Market Recap for Wednesday, September 6, 2017
Energy (XLE, +1.63%) has been the clear leader for the U.S. stock market the past week or so, but I'm not a fan just yet of the recent bounce continuing and morphing into an uptrend. Keep in mind that the sector - other than renewable energy ($DWCREE) - has been under tremendous selling pressure throughout 2017 and it's easily the weakest area of the market. The downtrend in the XLE has been well documented in the past, but let's visualize it again:
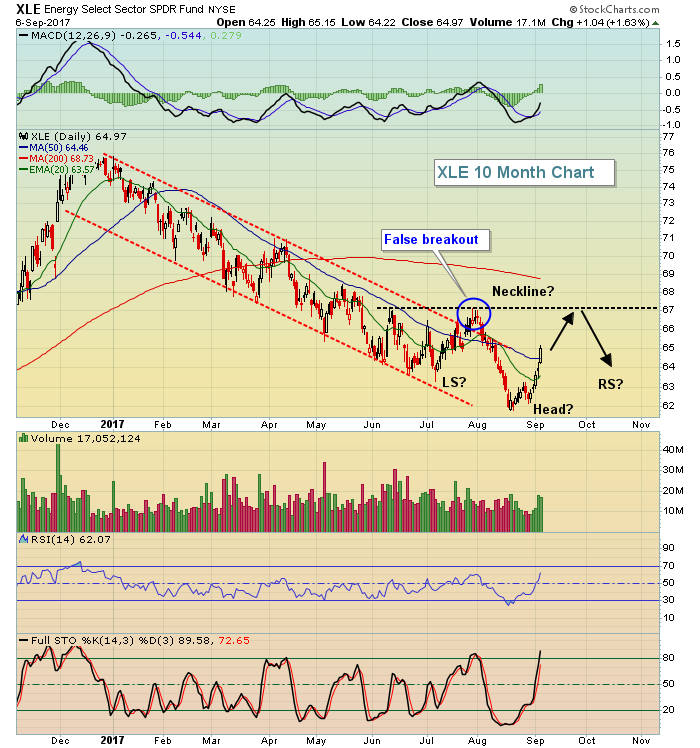 It appeared the down channel from the first half of 2017 had been broken in late July, only to fail at previously stalled price action near 67. That continues to be a major price resistance level and could set up a potential bottoming reverse head & shoulders neckline should the current strength continue. Why might it stall right here? Well, the best part of this energy rally has been oil equipment & services ($DJUSOI). This industry gained 1.3% yesterday and is now up 4.83% in just the past week. That's clearly a significant advance. The problem, however, is that the group was very oversold and a bounce was eventually going to happen. The recent rise now has the DJUSOI up against its first significant price resistance. Whether it breaks through will have a major impact on whether the current energy rally stalls. Here's the DJUSOI chart:
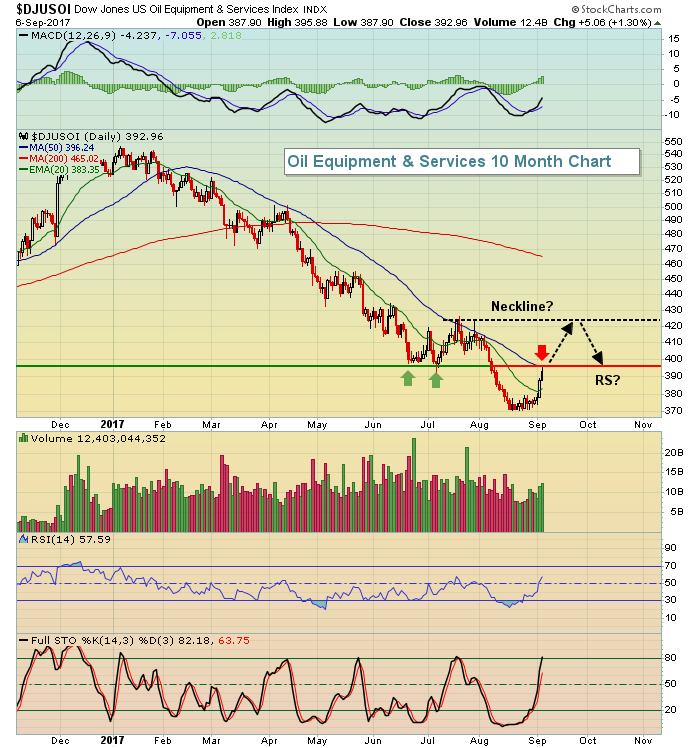 If the XLE is going to continue to rise, I believe the key will be whether the DJUSOI can clear price resistance at the 396 level. Should that happen, then I'd look for continuing strength on both the XLE and DJUSOI to reach those neckline levels. That's when a bullish bottoming formation could be in the process of forming. For now, I'd respect that intermediate-term downtrend that's been in play all of 2017.
Consumer discretionary (XLY, +0.62%) also had a strong session, thanks in large part to a very strong home improvements industry ($DJUSHI). That group is featured below in the Sector/Industry Watch section. Utilities (XLU, -0.46%) were the clear laggard during Wednesday's session.
Pre-Market Action
While the 10 year treasury yield ($TNX) pushed back above 2.10% on Wednesday, we're seeing another dip this morning to 2.08% and that could put pressure back on financial stocks as that group tends to struggle the most with declining treasury yields. Gold ($GOLD) remains in a very strong uptrend and it's up another 8 bucks this morning in early trade as the U.S. dollar (UUP) weakens further.
Crude oil ($WTIC) has been higher in its last four trading sessions, but black gold is approaching $50 per barrel and that's exactly where it had technical difficulties a little more than a month ago. The WTIC is down this morning just beneath $49. We'll see if it rebounds to continue its winning streak later today.
Asian stocks were mostly mixed overnight, while European shares are strong at last check. The German DAX ($DAX) is now back above the 12300 level. Here in the U.S., Dow Jones futures are flat with 30 minutes left to the opening bell.
Current Outlook
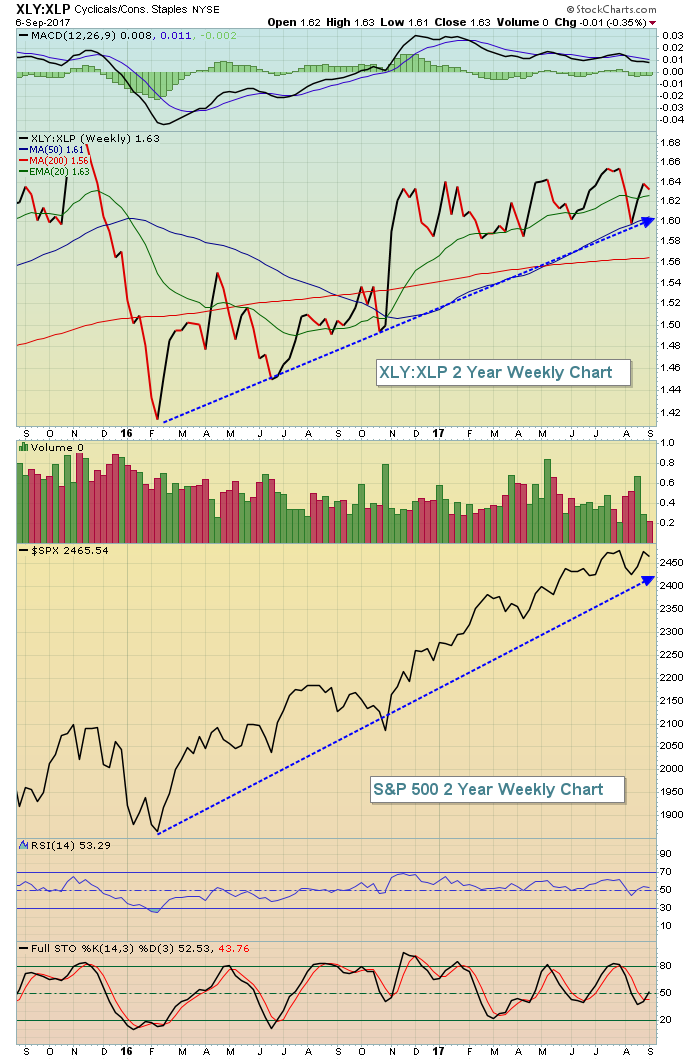
For those waiting for the relative strength of consumer discretionary stocks (XLY) to falter vs. their consumer staples counterparts (XLP), it just hasn't happened. A declining XLY:XLP ratio can be a warning signal as it provides evidence that traders are moving towards safety and that type of defensive behavior normally precedes bearishness in equities. I'm not talking about day to day movements in the XLY:XLP as it moves up and down quite a bit during both uptrends and downtrends in the S&P 500. The real warning occurs when the S&P 500 advances to new highs, only to be led by defensive stocks (ie, a rising S&P 500 with a declining XLY:XLP). Check out the current chart:
 The recent breakout in the 20+ year treasury bond ETF (TLT) is a cause for concern because it suggests a possible rotation from equities (aggressive) to bonds (defensive). As a result, I'm watching close the XLY:XLP ratio and also the relationship between transports and utilities ($TRAN:$UTIL). This ratio does not carry the same positive correlation with the S&P 500 as does the XLY:XLP, but it's still worth watching as transports should do better than utilities if our economy is truly expanding. The TRAN:UTIL ratio has been mostly in decline in 2017 as a result of declining treasury yields.
I'd conclude by simply pointing out that consumer stocks have not provided us any definitive signs of a market top. Therefore, I'd look for further strength in U.S. equities, but it might not be until later this year as the S&P 500 (and other major indices) continue to work off momentum issues on their long-term weekly charts.
Sector/Industry Watch
The Dow Jones U.S. Home Improvements Index ($DJUSHI) broke its recent 3-4 month downtrend with solid volume on Wednesday and that sets the group up for higher prices in the coming months:
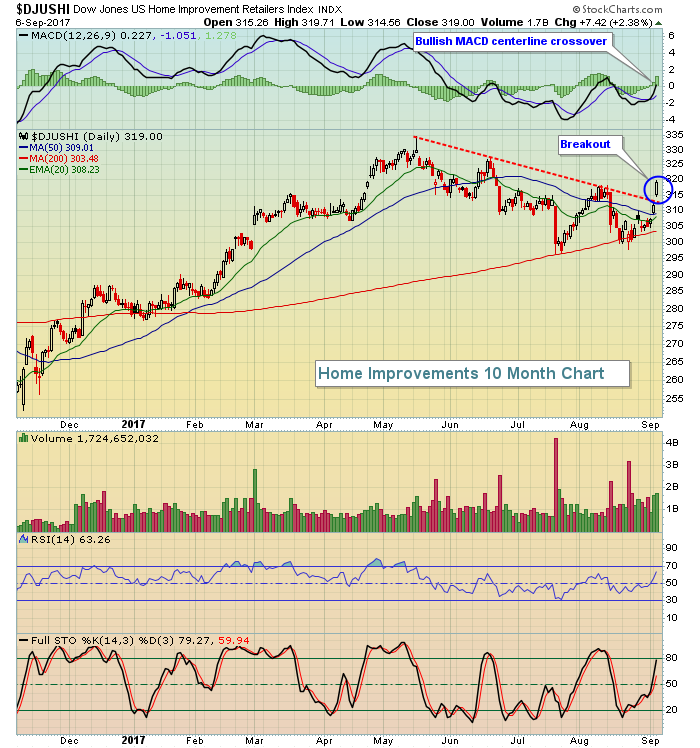 Note that the RSI busted above 60 for the first time in the past 3-4 months as well. Normally, during downtrends, the RSI is capped at 60. I'd view this as further technical evidence that a new uptrend has begun. Home Depot (HD) has a very nice looking chart that should be considered if you like the group's recent action and would like some exposure.
Historical Tendencies
Small cap stocks (Russell 2000) struggle during the summer months the same as its larger cap counterparts. August and September are both difficult months historically, but the bullishness normally resumes in October. Check it out:
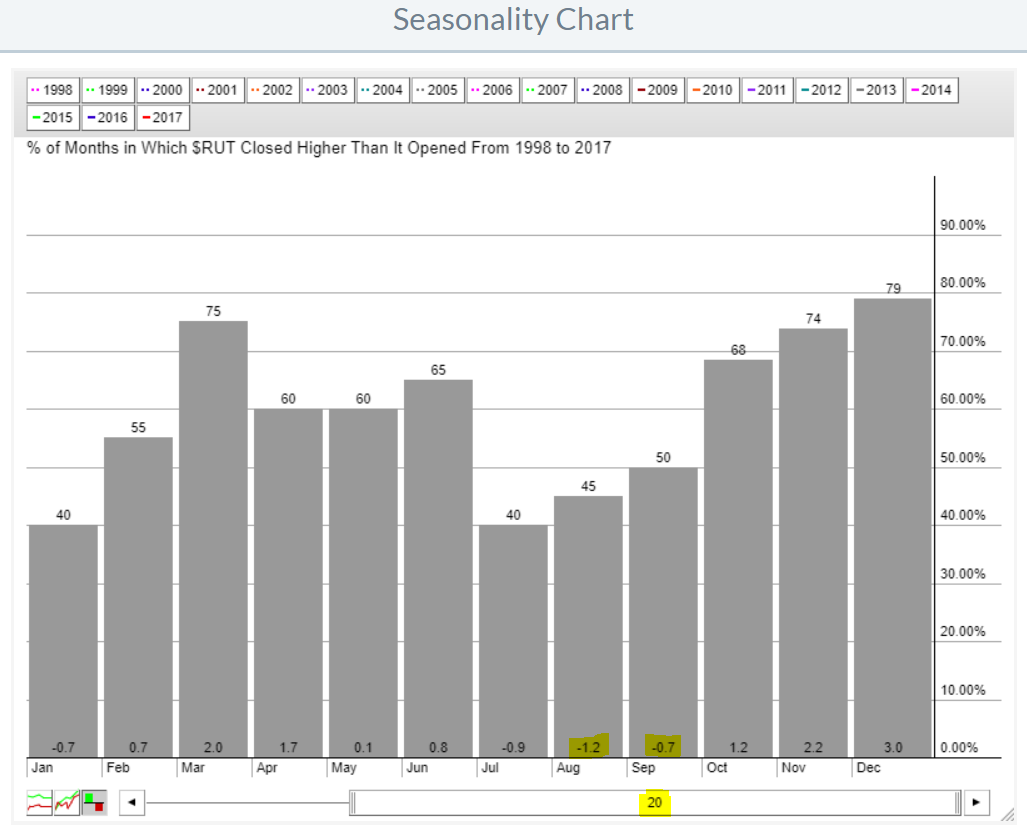 The odds of small caps moving higher during calendar months in the second half of the year accelerate as we grow deeper in the year. Average monthly returns do the same until we reach December, easily the best month of the year to invest in small cap stocks.
Key Earnings Reports
(actual vs. estimate):
LULU: .39 vs .35
Key Economic Reports
Initial jobless claims released at 8:30am EST: 298,000 (actual) vs. 241,000 (estimate)
Q2 productivity released at 8:30am EST: +1.5% (actual) vs. +1.3% (estimate)
Happy trading!
Tom


