Market Recap for Friday, September 15, 2017
It was another day of records on Wall Street to close out the week. Despite the peak of seasonal summer weakness approaching, buyers stepped up to the plate once again, this time driving S&P 500 prices to another all-time high close and, in the process, clearing a psychological level at 2500. Volume was extremely heavy, but don't read too much into that. It was quadruple witching day, which occurs the 3rd Friday of March, June, September and December. We always see heavy volume on these days as you can see below on the NASDAQ chart:
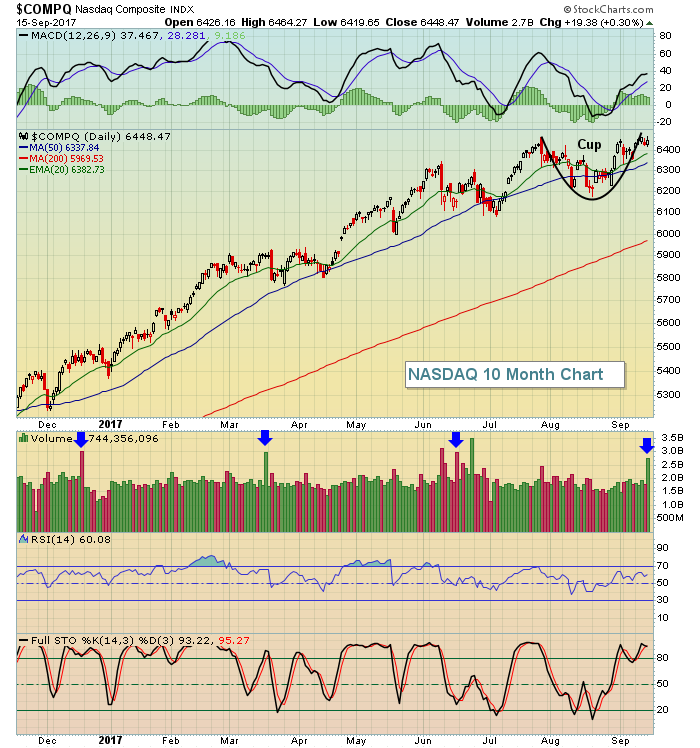 The volume on those quad witching days (blue arrows) really stick out and don't provide any additional bullish or bearish signals in my view. Just be aware that they occur quarterly. What I would focus on, however, is the bullish cup that's taken place here on the NASDAQ. Given the recent breakouts on the Dow Jones and S&P 500, I'd expect to see the NASDAQ follow suit with a breakout as well.
On Friday, leadership came primarily from technology (XLK, +0.41%) and industrials (XLI, +0.41%). The latter actually broke out to a fresh new high, highlighted by strength in transports ($TRAN). Both the railroads ($DJUSRR) and truckers ($DJUSTK) led the transports rally with gains in excess of 1%. The top performing sector of late - healthcare (XLV, -0.32%) - saw profit taking, although there was no technical damage inflicted with the selling. It was simply a healthy pause after recent strength.
Pre-Market Action
This isn't the best historical period of the year, but Dow Jones futures are higher by 45 points nonetheless. There are no significant earnings or economic reports out today, so U.S. equities will likely follow the lead of global indices and technical indications. Both should help. Asian markets were higher overnight, highlighted by a 1.27% advance in the Hang Seng Index ($HSI). In Europe this morning, we're also seeing higher prices with major indices there up between 0.25% and 0.50% at last check.
Gold ($GOLD) is lower and approaching its first key price support test near 1300. Crude oil ($WTIC) continues to hover just beneath $50 per barrel. The U.S. Dollar ($USD) is higher this morning as Wall Street awaits the latest Fed decision, which will be announced on Wednesday at 2pm EST.
Current Outlook
If there's one negative as we open this new trading week, it's that there's a short-term negative divergence on our major indices that's accompanying the new highs. Last week, I highlighted the Dow Jones. Here's the S&P 500:
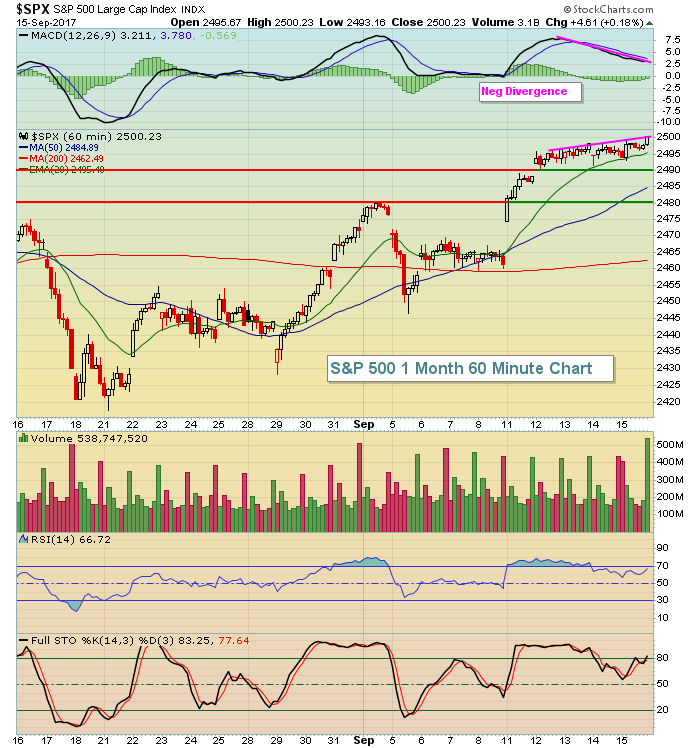 If we do see any short-term selling, look for the area between 2480-2490 to provide short-term support.
Sector/Industry Watch
Transportation stocks ($TRAN) are regaining their mojo and that could really help U.S. equities into year end. The recent breakout is now accompanied by a rising MACD - indication of accelerating bullish momentum. Have a look:
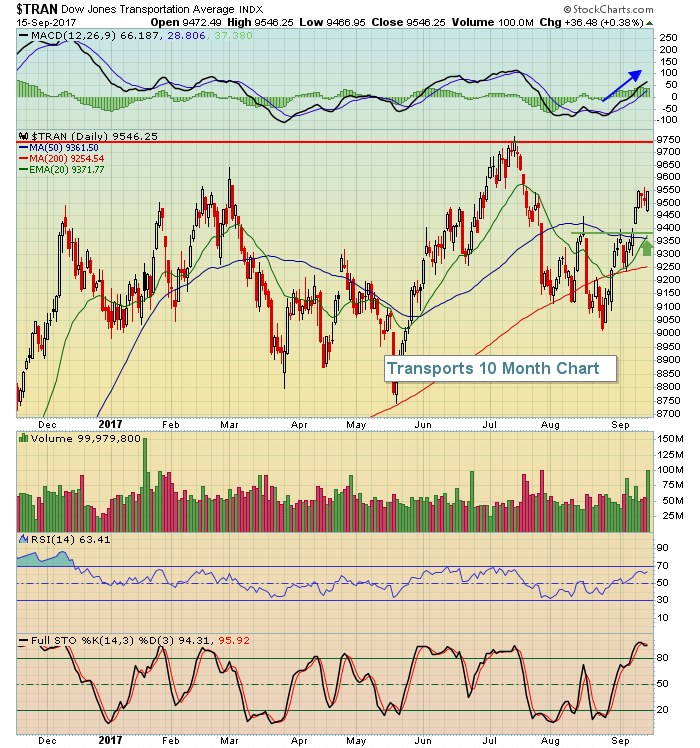 I'm looking for a revisit at price resistance near 9750. To the downside, the TRAN should have excellent price, gap and moving average support close to 9390.
Monday Setups
Every Monday, I prepare setups for the upcoming week. I provide one here in my article and others in my Trading Places ChartList. I try to highlight high reward to risk trading opportunities, focusing on patience and discipline to allow these potential trades to set up. They're educational in nature, but could provide trading ideas as well. Feel free to check them out HERE.
For this week, I like Catalent, Inc. (CTLT). I've discussed this one during the Earnings Spotlight segment on MarketWatchers LIVE. I wanted to see a pullback to the rising 20 day EMA and we're just about there. Also, there should be solid gap support at 38.54. Here's the current chart:
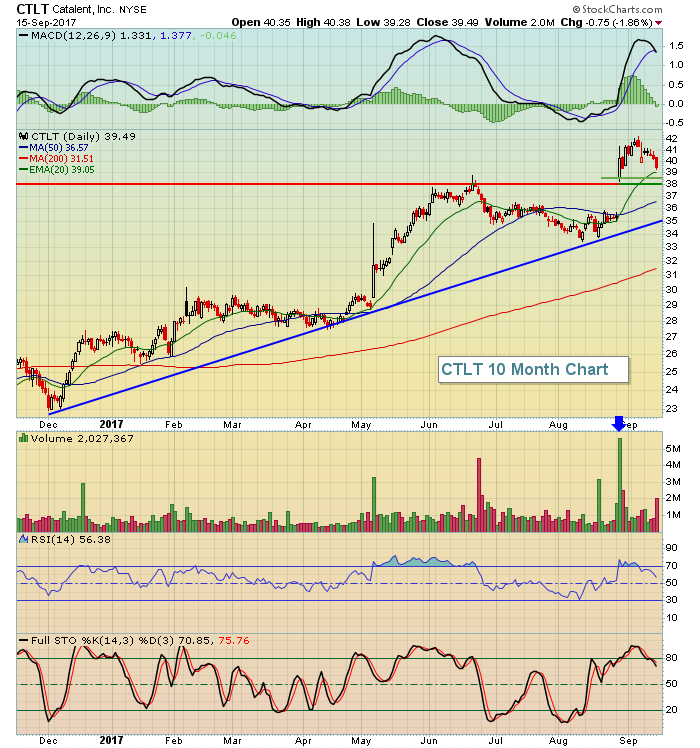 While we could see a trendline test at any time, my guess is we'll see that later in 2017. For now, I expect short-term weakness to be met with buying from the 20 day EMA, currently at 39.05, down to gap and price support at 38.54 and 38.02, respectively.
Historical Tendencies
Here's a breakdown of how the NASDAQ has performed since 1971 within calendar months:
26th to 6th: +21.30%
7th to 10th: -2.52%
11th to 18th: +17.33%
19th to 25th: -6.82%
It's helpful to remember these market tendencies, especially if you're a short-term equity trader or an options trader. In September, the most bearish part is from the 20th through the 30th, where the NASDAQ has produced annualized returns of -41.21% over the past 46 years.
Key Earnings Reports
None
Key Economic Reports
September housing market index to be released at 10:00am EST: 65 (estimate)
Happy trading!
Tom


