Market Recap for Wednesday, October 11, 2017
A strange pair - utilities (XLU, +0.43%) and technology (XLK, +0.33%) - combined to lead our major indices higher on Wednesday with the NASDAQ rising 0.25% to close at another all-time high. Seven of the nine sectors ended the day in positive territory as only financials (XLF, -0.19%) and industrials (XLI, -0.06%) were down. Among the major indices, only the Russell 2000 finished lower, dropping a mere 0.07%. Overall, it was another solid day, especially considering that most indices and sectors were overbought entering the day.
Footwear ($DJUSFT) continues to be a drag within the discretionary group as it fell another 1.19% to challenge a couple key levels of price support:
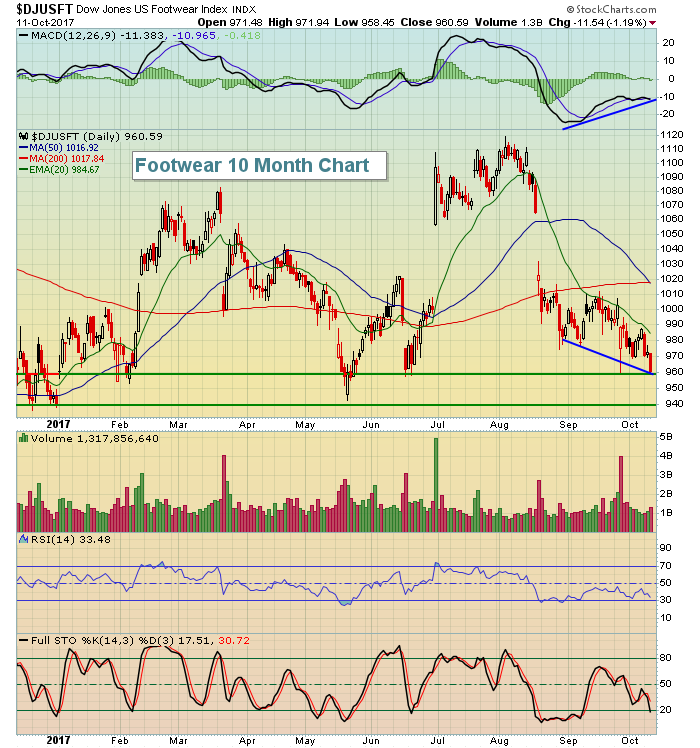 The positive divergence gives this industry group some short-term hope and a reversing candle on solid volume would be a very solid reward to risk entry. Nike's (NKE) chart looks very similar to the DJUSFT if you want to consider entry into an index component.
Pre-Market Action
Despite a more inflationary core PPI reading (+0.4% vs. +0.2%) than expected, the 10 year treasury yield ($TNX) is flat this morning as bond traders contemplate the Fed's next move. A week or two ago, there were little prospects for a rate hike at the FOMC meeting that begins later this month. Instead, traders were focusing on the December meeting for another possible rate hike. However, given the inflationary developments from the latest jobs report, there could be more pressure on the Fed to raise at its next meeting. 2.40%-2.41% is clear yield resistance on the daily chart so that's the level I'd follow closely.
The Dow Jones futures are pointing to a slightly lower open in 30 minutes.
Current Outlook
The U.S. Dollar ($USD) has key implications in various sectors. A rising dollar with rising interest rates, for instance, can be extremely bullish for financial stocks. The USD's pattern below has been one of lower prices throughout 2017, but there's technical hope of a reversal:
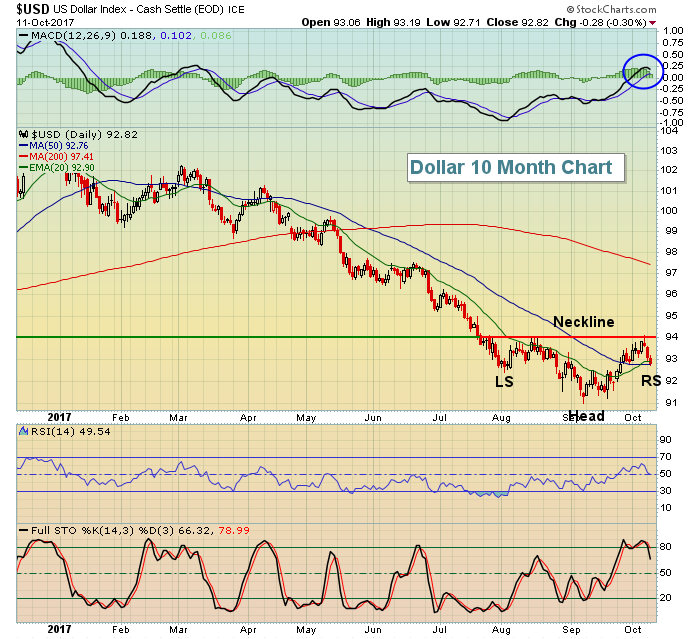 The dollar's recent weakness could be establishing a right shoulder in bullish reverse head & shoulders pattern. These patterns do not confirm, however, until the neckline is cleared. A move below 91 would negate the pattrn altogether.
Sector/Industry Watch
Recently, I highlighted specialty retailers ($DJUSRS) and showed their strength despite an overall bearish environment in 2017 for retail stocks in general. Well, broadline retailers ($DJUSRB) also look much better than retail in general as you can see below:
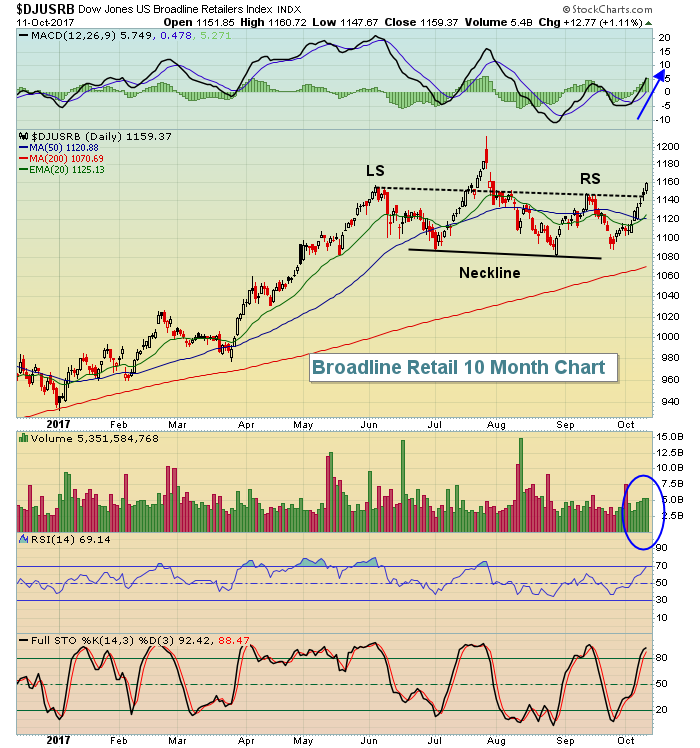 There most definitely was a potential topping head & shoulders pattern in play, but I tend to ignore topping patterns during bull markets UNLESS "under the surface" signals begin to turn bearish. I don't see such bearish signals now, so the breakout in the DJUSRB looks like the real deal to me. 1200 is now the target to test the high established back in late-July.
Historical Tendencies
The S&P 500 has produced annualized returns of +10.88% during the month of October since 1950. If we ignore the October 22nd to October 27th period, that October annualized return balloons to +23.61%. I'll post more on that October 22-27 period next week as we approach the most bearish week of the year.
Key Earnings Reports
(actual vs. estimate):
C: 1.42 vs 1.32
JPM: 1.76 vs 1.67
Key Economic Reports
Initial jobless claims released at 8:30am EST: 243,000 (actual) vs. 252,000 (estimate)
September PPI released at 8:30am EST: +0.4% (actual) vs +0.4% (estimate)
September Core PPI released at 8:30am EST: +0.4% (actual) vs. +0.2% (estimate)
Happy trading!
Tom


