Market Recap for Friday, October 9, 2017
Extremely overbought and extended conditions. Complacency in the form of a very low Volatility Index ($VIX) reading. Geopolitical tensions. Then a negative jobs report. The market was surely doomed on Friday, right? Wrong. That complacency, as evidenced by near record low readings in the VIX, is a signal that the stock market has the ability to overlook bad economic news - or any news for that matter. And THAT, in a nutshell, sums up the market action from Friday. The September nonfarm payrolls were reported at a minus 33,000! That was 133,000 jobs short of the +100,000 consensus estimate. Throw in the tighter than expected labor conditions and a big unexpected spike in average hourly earnings and talk of wage inflation surfaced. The stock market's reaction? One giant collective YAWN. And it's the stock market's reaction - the price action - that matters more to me than the fundamental news.
Friday ended up being a bifurcated day with leadership from the NASDAQ, while we saw slight weakness in the Dow Jones, S&P 500 and Russell 2000. The best four sectors? How about technology (XLK, +0.15%), consumer discretionary (XLY, +0.12%), financials (XLF, +0.11%) and industrials (XLI, -0.01%). While those certainly aren't earth-shattering returns, I just find it very comforting from a bullish perspective that on a day when there are very real signs of a potential economic slowdown, money rotates from treasuries to equities and the four best sectors are aggressive areas of the market. While some view low VIX readings as bearish, I do not. The last two bear markets started with VIX readings above 16-17 and the VIX remained above that level throughout both entire bear markets. The VIX closed at 9.65 on Friday, one of the lowest readings on record, just hours after a huge jobs miss. If the stock market can endure a 133,000 jobs miss, you have to wonder what it will take to derail this bull market advance.
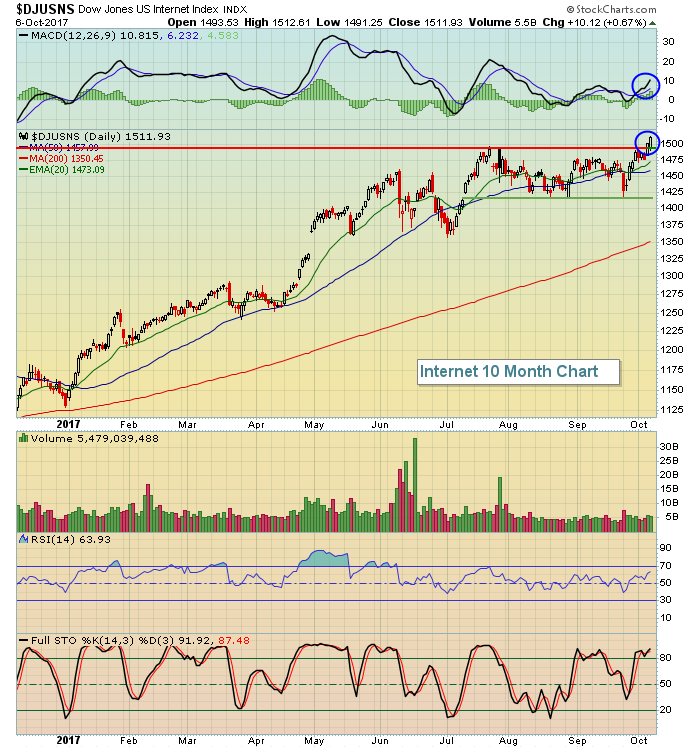
One area that certainly ignored fundamental issues on Friday and instead focused on its prior day's technical breakout was internet stocks ($DJUSNS). They rallied again on Friday:
 This advance shows no signs of slowing down as earnings season approaches and traders are likely building in a very strong earnings season into the prices of high-flying internet companies.
Pre-Market Action
The 10 year treasury yield ($TNX) is flat this morning, but that's not hurting equity prices. Dow Jones futures are up 40 points this morning as the U.S. apparently prepares to ignore the lead of global equities overnight and this morning as those indices are mostly mixed.
Current Outlook
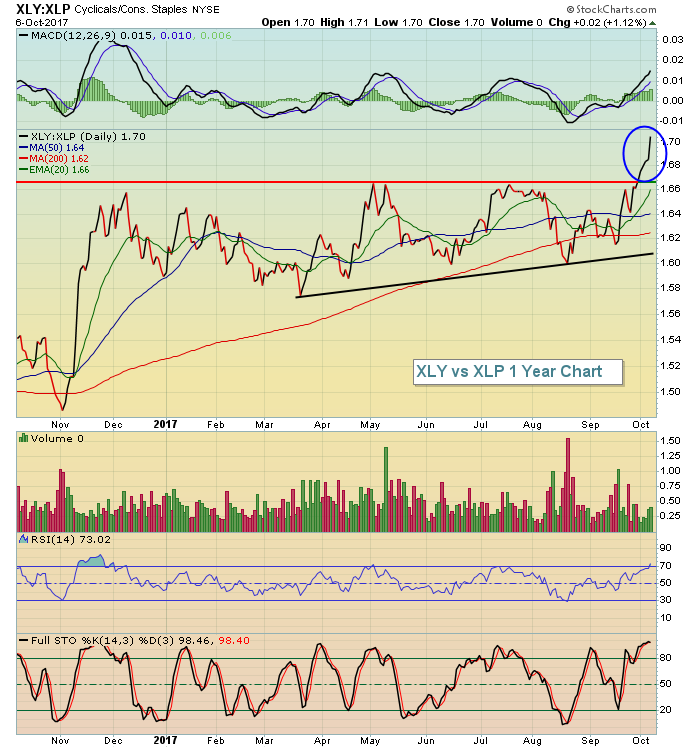
Friday was yet another example of money rotating to riskier areas of the market. My favorite relative ratio is the XLY:XLP (consumer discretionary vs. consumer staples). This ratio has been rising consistently throughout the latest bull market advance and it provides evidence that market participants are not holding back. They're jumping into the more aggressive discretionary stocks with both feet and that's typically a sign of a sustainable rally. A one year chart illustrates the significance of the most recent relative breakout:
 If you look back to November 2016, you'll see a very similar relative rise in the XLY:XLP. That accompanied a significant rise in U.S. equities and that rally proved to be sustainable. I suspect this one will as well.
Sector/Industry Watch
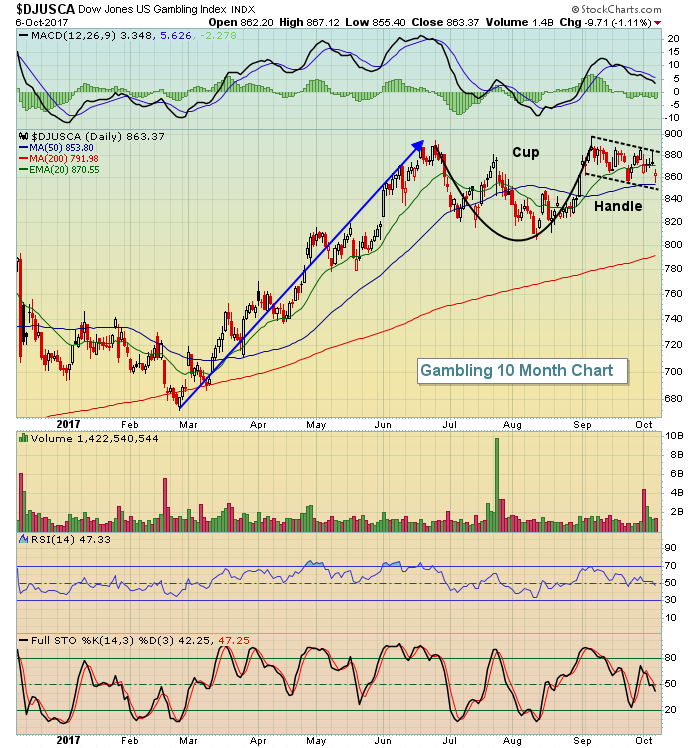
The Dow Jones U.S. Gambling Index ($DJUSCA) has been the weakest industry group within consumer discretionary over the past week, but after failing to break out in early September, I warned that this group was risky to hold and it's turned out to be a correct call. The DJUSCA remains a very bullish industry group that just happens to be consolidating with money rotating to other areas. I expect it will return....and probably quite soon:
 This is a bullish continuation pattern so look for a breakout above 895 to trigger the next wave of buying.
Monday Setups
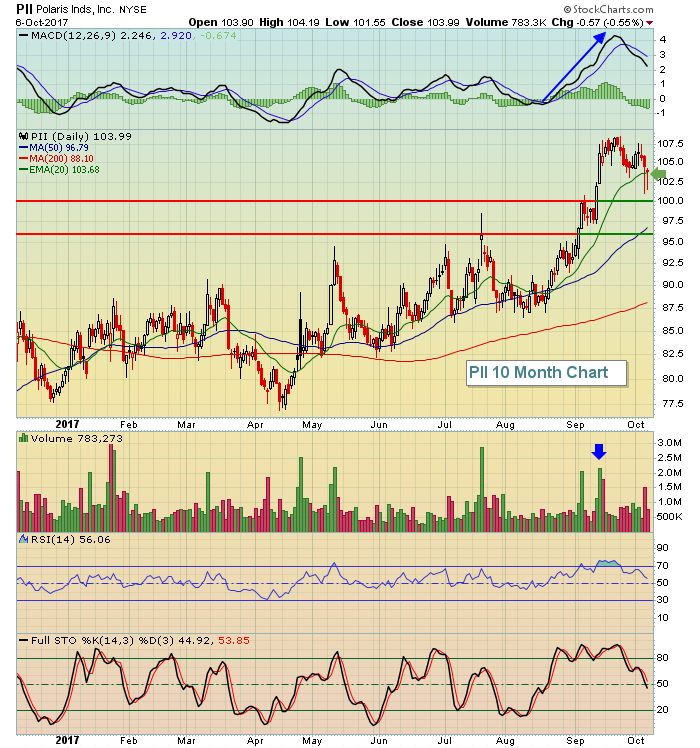
Each week, I provide one trade setup on Monday that appears to be on solid technical footing and close to key support in order to manage risk. This week, I'm looking at Polaris Inds (PII). After a solid volume breakout above 100 in mid-September, PII became quite overbought with its RSI approaching 80 and stochastic well into the 90s. Simply put, it needed a breather. We've seen that breather over the past couple weeks and on Thursday and Friday, PII traded beneath its rising 20 day EMA, only to finish above it. I believe that could mark a short-term bottom:
 The blue directional line shows that at the most recent price high, bullish momentum was very strong. That typically results in excellent support at the rising 20 day EMA, which is what we saw on Thursday and Friday. I'd look for recovery to test the recent price highs. If the 20 day EMA is breached, all is not lost. PII broke out above longer-term price resistance in the 97-100 range and if the 20 day EMA fails to provide support, I'd expect that 97-100 range to attract a ton of buyers - should price action move that low.
Later this afternoon at 4:30pm EST, I'll be joining John Hopkins, President of EarningsBeats.com, for a webinar to discuss the upcoming earnings season (including the potential for pre-earnings rises on a few stocks), the importance of managing risk and how to develop a ChartList here at StockCharts.com. To register and for more information regarding topics and cost, CLICK HERE.
Historical Tendencies
From a historian's perspective, if the NASDAQ is to be weak at any point this week, it's typically today. Check out the annualized returns for each day this week (since 1971):
Monday (October 9): -85.62%
Tuesday (October 10): +42.23%
Wednesday (October 11): +110.95%
Thursday (October 12): +16.44%
Friday (October 13): +133.17%
Key Earnings Reports
None
Key Economic Reports
None
Happy trading!
Tom


