Market Recap for Wednesday, October 25, 2017
It's difficult to know what to expect after U.S. equities posted their largest decline since September 5th. I don't recall the last time we saw all nine sectors lower, but that's exactly what we saw on Wednesday. Healthcare (XLV, -0.14%) was the best performing sector while industrials (XLI, -0.99%) were hit the hardest. Transportation stocks ($TRAN) had a very rough day as airlines ($DJUSAR, -2.83%) and railroads ($DJUSRR, -2.67%) were the two worst performing industrial groups.
Airlines fell below their 20 week EMA, currently at 268.47, but have two days to rectify that issue on its weekly candlestick chart. Railroads are truly at a crossroads as their weakness took the group down to test key price support on its long-term weekly chart:
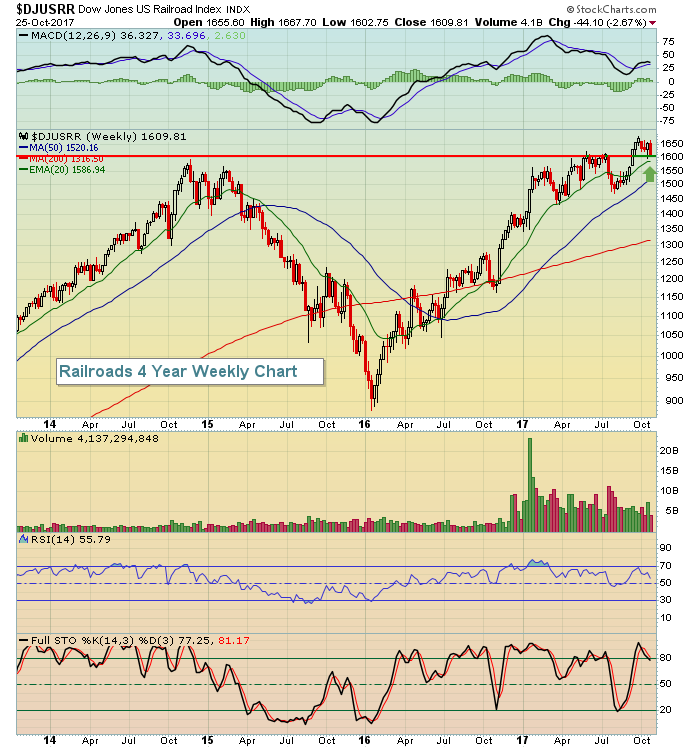 The 20 week EMA is at 1587, so that's a fairly significant moving average to watch. Failure to hold that level would likely result in further selling down to the 1475-1525 zone.
There weren't many pockets of strength yesterday, but Nike (NKE) rose 2.85% to lead a strong footwear group ($DJUSFT) higher.
Pre-Market Action
European markets are rebounding this morning after Asian markets performed relatively well overnight. That's enabling U.S. futures to remain in positive territory this morning as equities here attempt to recover some of the losses from Wednesday.
Currently, Dow Jones futures are higher by 57 points, although futures gains on the S&P 500 are more modest, while the NASDAQ actually shows a bit more weakness this morning.
Current Outlook
Sit back and relax while I have a little back and forth discussion with myself.
There were a couple positives that immediately struck me from Wednesday's action. First and foremost, the S&P 500 bounced off price support and the rising 20 day EMA - exactly as the bulls would hope for with selling escalating. Here's a reprint of a chart I posted yesterday:
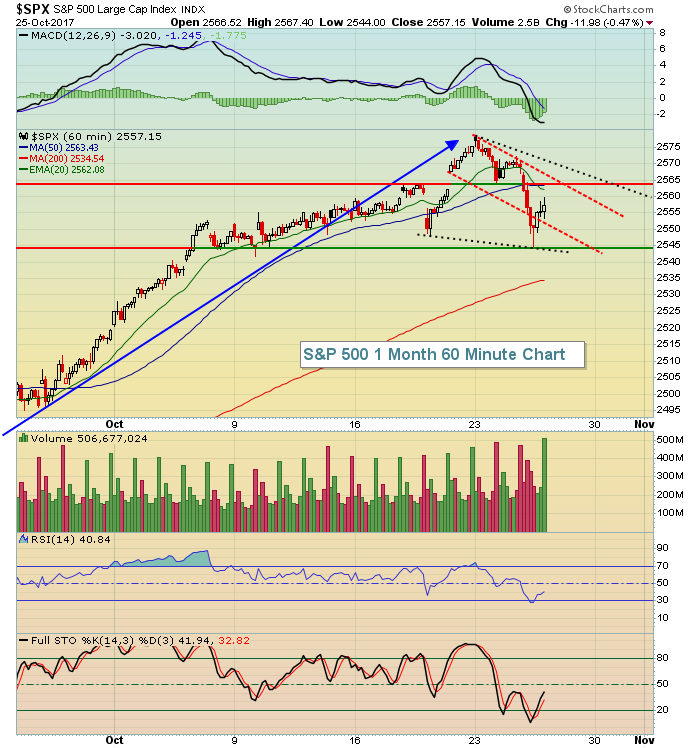 The red dotted channel lines represented a possible channel that I thought might form to help unwind the extremely overbought conditions. The selling, however, was a bit more intense than I considered so I've added black dotted lines above to outline what could develop into a bullish wedge. A really big key right now is whether yesterday's low of 2544, which hit price support, holds. If it doesn't, then I believe we'll be in a much more extended period of selling and consolidation, lasting anywhere from a couple weeks to a month or more. The other positive news on Wednesday was the reaction in the Volatility Index ($VIX) during the afternoon session. The VIX had spiked intraday to 13.20, but by the close had fallen back down to 11.23. The VIX fell nearly a full point in the final hour alone. That left a long tail to the upside that you can see in the Sector/Industry Watch section below.
Now for the more bearish argument. We are very extended on the weekly chart and just about every time we've seen the weekly RSI hit 70 or higher, the subsequent decline tests the rising 20 week EMA. Check out this longer-term weekly chart:
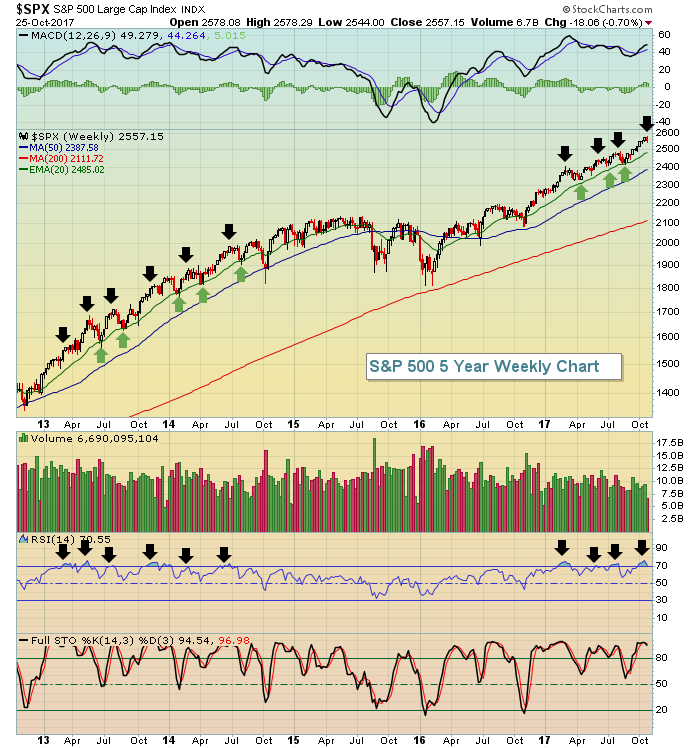 The black arrows show where the S&P 500 was each time it had a weekly RSI reading at 70 or above. In just about every case, we saw a subsequent 20 week EMA test. Please note, however, that these weekly overbought readings did not mark major tops. Rather, they simply warned us of a possible short-term pullback to help unwind that RSI down into the 50s. If we lose the 2544 price support mentioned earlier, I expect we'll approach, and possibly test, the rising 20 week EMA, currently at 2485.
Sector/Industry Watch
The volatility index ($VIX) surged, and then retreated, to end Wednesday's session with a long tail to the upside. If the bears want to further establish a downtrend in place, it'll likely require another surge in the VIX to clear the 13.20 high that printed yesterday. Check out the chart:
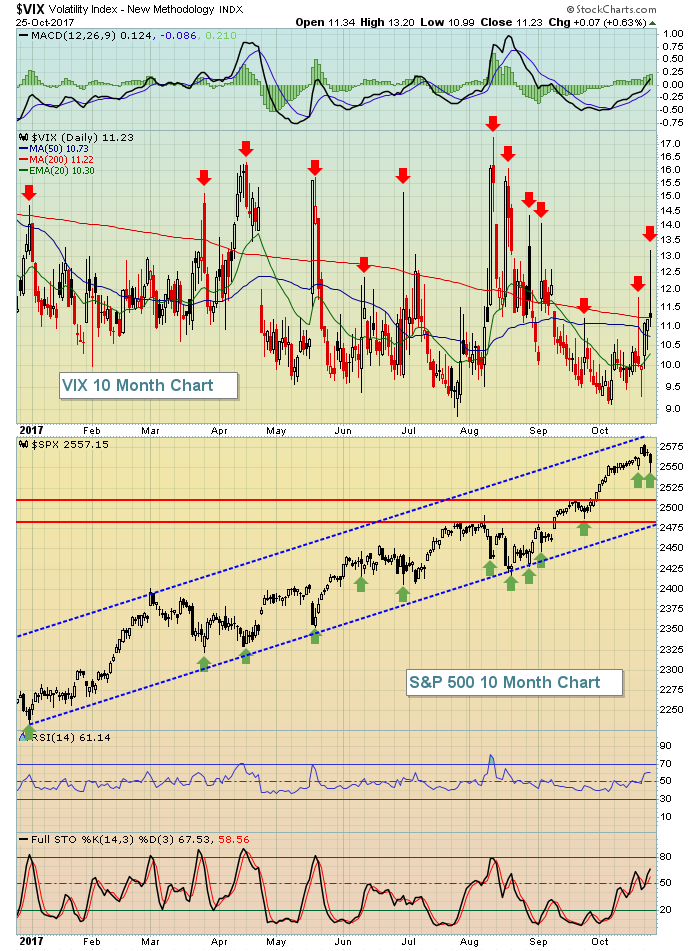 Note how nearly every top in the VIX results in a long tail to the upside or a long filled candle body (this means the VIX closes near or on its low of the day after opening near or on its high of the day). Both types of candles tell us that the VIX finishes way below its earlier high. These tops (red arrows) coincide generally with S&P 500 bottoms (green arrows). A spike in the VIX above 13.20 that coincides with an S&P 500 decline beneath 2144 price support would likely spook the bulls and ignite further selling.
Historical Tendencies
If you recall, I indicated that the worst period in the stock market was from mid-July through late September. Weakness in the S&P 500 triggers higher VIX readings and the following seasonal chart really sums up the bearish historical summertime action:
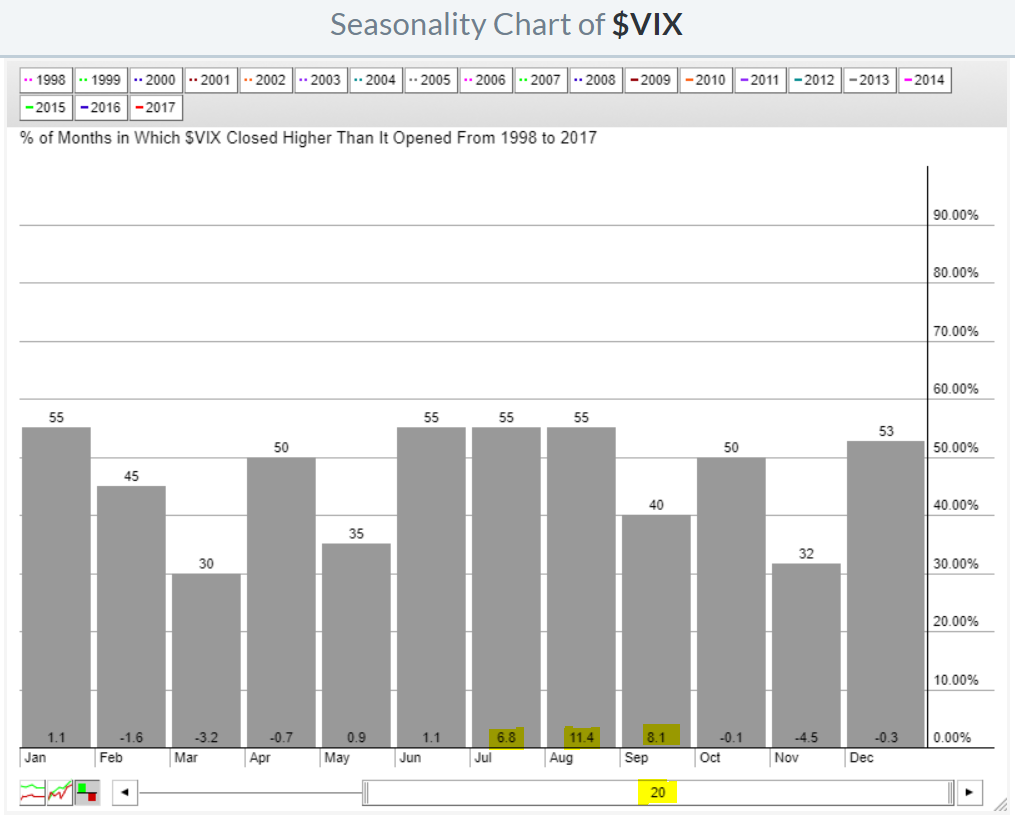 The biggest moves higher in the VIX typically occurs from July to September, which makes perfect sense as that period produces more bearish action than the other nine months of the year. The upcoming month of November historically (at least over the last two decades) has produced the largest declines in the VIX. So if we see a spike in the VIX to close out October, I'd expect to see it settle down in November as historical bullish tailwinds resume.
Key Earnings Reports
(actual vs. estimate):
ALXN: 1.44 vs 1.33
BCS: .25 (estimate - disappointing results are in, but I can't find a comparable EPS number yet)
BUD: 1.31 vs 1.25
BMY: .75 vs .77
CHTR: 1.04 (estimate - actual shows .19, but likely not comparable)
CELG: 1.91 vs 1.87
CMCSA: .52 vs .49
CME: 1.19 vs 1.16
COP: .16 vs .09
F: .43 vs .33
LUV: .88 vs .87
MMC: .79 vs .78
MO: .90 vs .87
NEE: 1.85 vs 1.75
NOK: .09 vs .06
RTN: 1.97 vs 1.90
UPS: 1.45 vs 1.44
VLO: 1.91 vs 1.83
(reports after close, estimate provided):
AMZN: .01
CB: (.26)
GILD: 2.09
GOOGL: 8.43
INTC: .80
MSFT: .72
SYK: 1.50
Key Economic Reports
Initial jobless claims released at 8:30am EST: 233,000 (actual) vs. 235,000 (estimate)
September pending home sales to be released at 10:00am EST: +0.4% (estimate)
Happy trading!
Tom


