Special Note
Every Monday, I provide possible short-term trade setups (today's featured setup is reflected below in the Monday Setups section). All of these setups, along with setups from the past few weeks, can be accessed by CLICKING HERE. If you'd like to review these setups each Monday and read my daily market recap and forecast, please subscribe at the bottom of this article. Simply type in your email address and click on the green "Notify Me!" button and my article will be sent to your inbox every morning before the stock market opens.
Market Recap for Friday, October 27, 2017
The NASDAQ led a powerful advance on Friday as four key NASDAQ giants all posted exceptionally strong quarterly earnings reports. Amazon.com (AMZN), Alphabet (GOOGL), Microsoft (MSFT) and Intel (INTC) did not disappoint their respective shareholders as each blew out revenue and EPS estimates and this strong earnings growth is likely to help power U.S. equities higher in time. Leaders leading is exactly what you want to see and bulls got their wish to close out last week. The NASDAQ gained an impressive 144 points, or 2.20% and this strength carried over into all of our major indices and sectors, thought the more aggressive areas benefited the most.
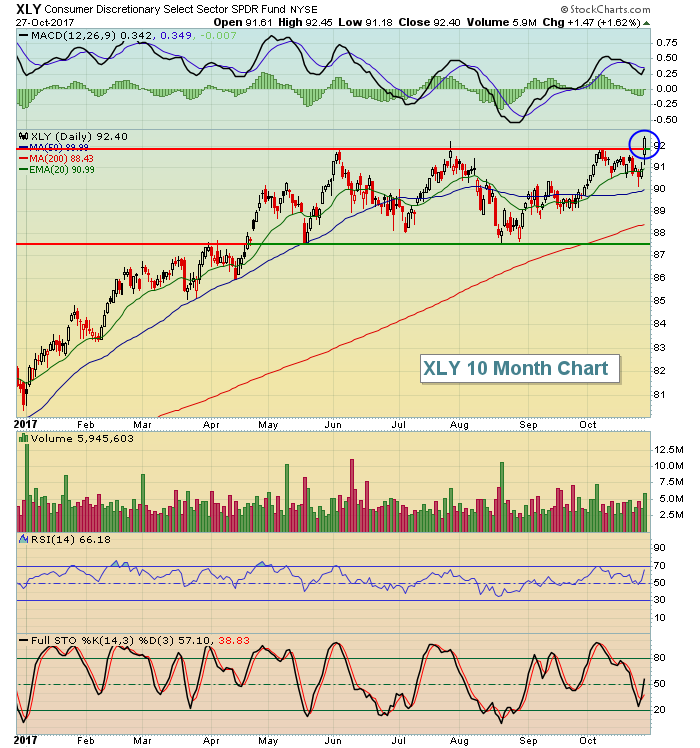
The Russell 2000 gained 0.78% (and the benchmark S&P 500 climbed a similar amount) as technology (XLK, +2.69%) and consumer discretionary (XLY, +1.62%) soared. On the other side of the spectrum, consumer staples (XLP, -0.86%) broke down and, as you might suspect, the XLY:XLP ratio saw a major spike. First, let's look at the break0ut on the XLY:
 Now check out the relative ratio (XLY:XLP):
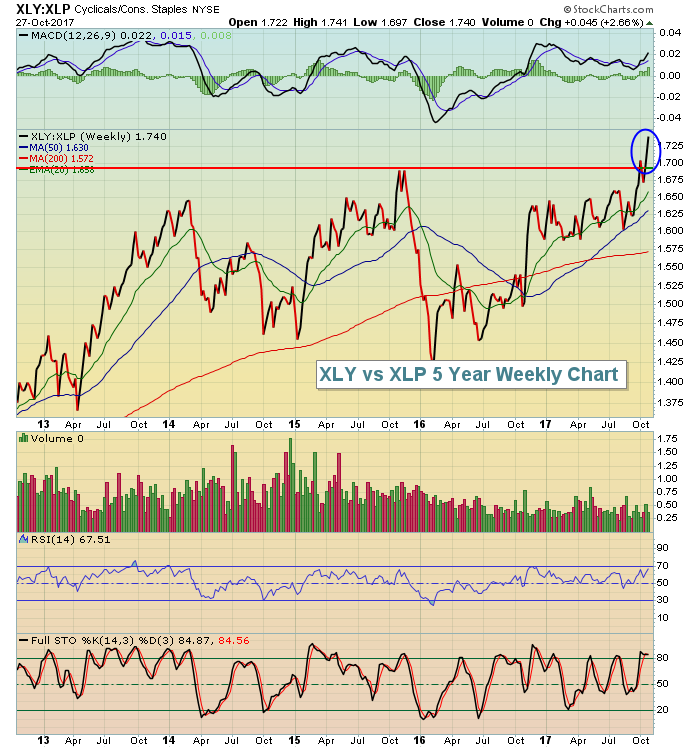 I had been awaiting this breakout to confirm the sustainability of the current bull market advance. Historically, a breakout in this ratio signals traders' increasing appetite for risk, an essential component to any bull market. The action here is very bullish indeed for the performance of U.S. equities into year end and into 2018.
Pre-Market Action
Global markets are mixed this morning and falling treasury yields are having an impact on equity prices as we move towards the end of October. Dow Jones futures are down 66 points as we near the beginning of a new trading week. NASDAQ futures, however, are flat as they once again look to provide leadership.
Current Outlook
This morning we're gapping lower on the 10 year treasury yield ($TNX), leaving an island cluster reversal on its chart. These reversal patterns are typically short-term signals so I'd look for the TNX to potentially test its rising 20 day EMA as follows:
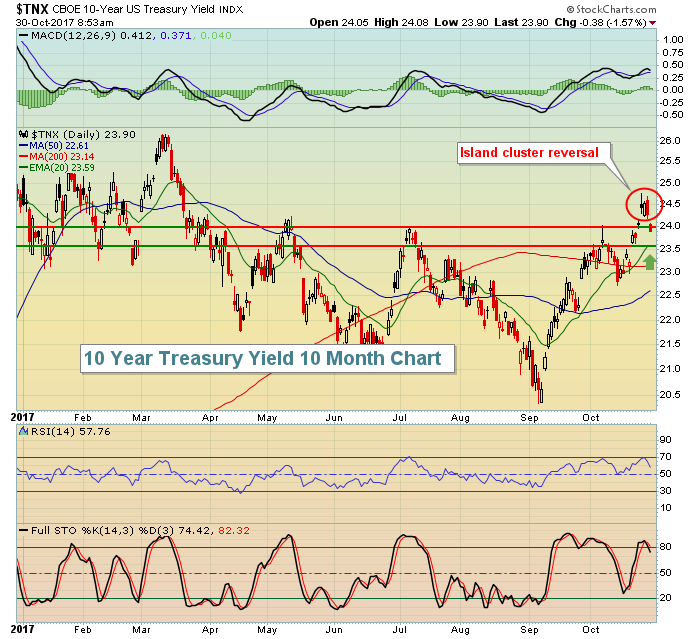 Failure to hold that rising 20 day EMA would not only send the TNX lower, but it also would be a signal of money moving into the treasury market, a potentially short-term bearish development for equities. Given the overbought condition in the U.S. equities market, a breakdown in the TNX could be a serious stumbling block for U.S. stocks. I don't mean to contradict the bullish XLY:XLP development discussed earlier. I'm merely referring to a short-term stumbling block. Beneath the surface signals suggest this bull market is nowhere near being complete.
Sector/Industry Watch
Over the past three months, the Dow Jones U.S. Broadcasting & Entertainment Index ($DJUSBC) has been the worst performing industry group within consumer discretionary (XLY) and one of the worst in the entire market. There was a huge reversal in the group, however, on Friday that I believe has marked a significant low. The intraday low on Friday of 1178.69 needs to hold as support, while the first key test on a bounce will be the rapidly-declining 20 day EMA, currently at 1232.06. Check it out:
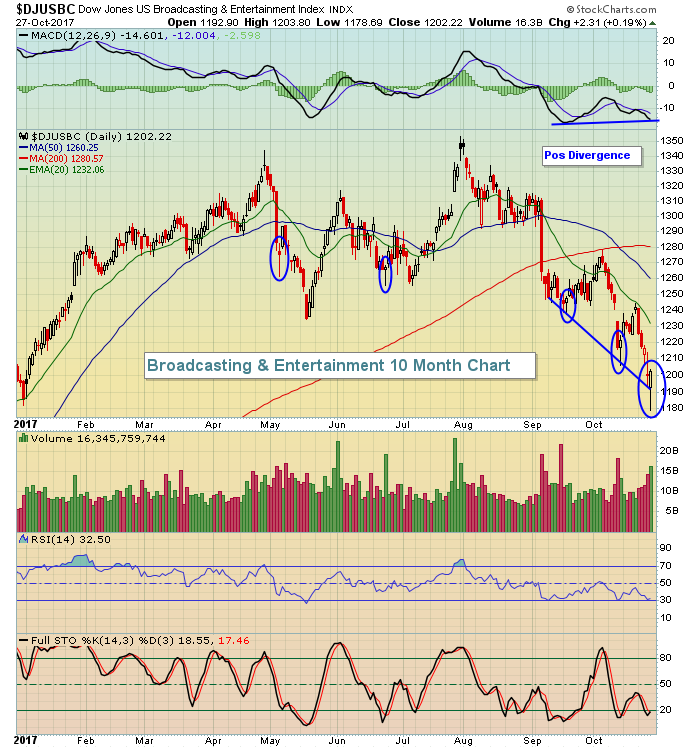 Off of downtrends, each of those blue circles above marked key short-term lows. Note the long tails and the hammers (mostly) that printed. We typically will see a bounce after such bullish reversals and I expect one here. The falling 20 day EMA will be the initial test, although with a positive divergence in play, we could definitely see more strength than that.
Monday Setups
Every Monday, I provide a potential trade setup right here in this blog. The setups are short-term in nature, looking for a quick bounce off key support generally. Over the weekend, I wrote about JD.com (JD) in the Don't Ignore This Chart blog and I'm going to feature that stock as my Monday Setup. JD printed a hammer on Friday after completely filling its earnings-related gap higher from May. I would expect a bounce higher from this level:
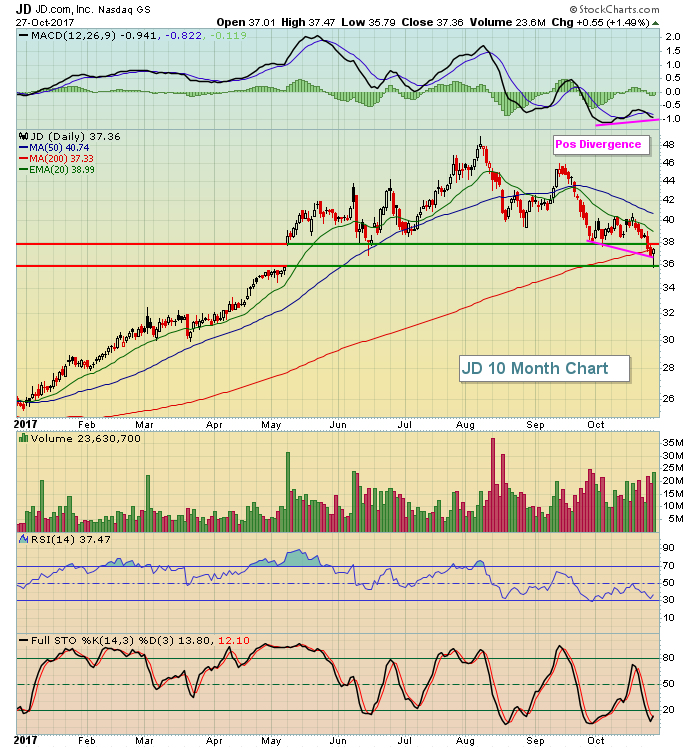 Friday's intraday low of 35.79 should now serve as key price support so I'd consider exiting on any close beneath that level (intraday stop would be even more conservative). The first key level of price resistance would be near the 40.50 level, although I could see a possible move to 46 to match the mid-September high and print the right side of a neckline in a bullish inverse head & shoulders continuation pattern off the longer-term uptrend.
Historical Tendencies
Last week I discussed the bullish nature of the current historical period (October 28 through November 6). But most months are very bullish the last couple days of a calendar month and the subsequent couple of days of the next calendar month. Here are the numbers for the NASDAQ (since 1971):
30th day of all months: +9.61%
31st day of all months: +47.89%
1st day of all months: +58.80%
2nd day of all months: +34.30%
Key Earnings Reports
(actual vs. estimate):
D: 1.04 vs 1.03
FDC: .40 vs .40
L: .46 vs .02
ROP: 2.36 vs 2.30
SRE: 1.04 vs 1.04
(reports after close, estimate provided):
AVB: 2.26
EIX: 1.33
MDLZ: .54
SBAC: .25
VNO: .51
Key Economic Reports
September personal income released at 8:30am EST: (actual) vs. +0.4% (estimate)
September personal spending released at 8:30am EST: (actual) vs. +0.9% (estimate)
Happy trading!
Tom


