Market Recap for Friday, September 29, 2017
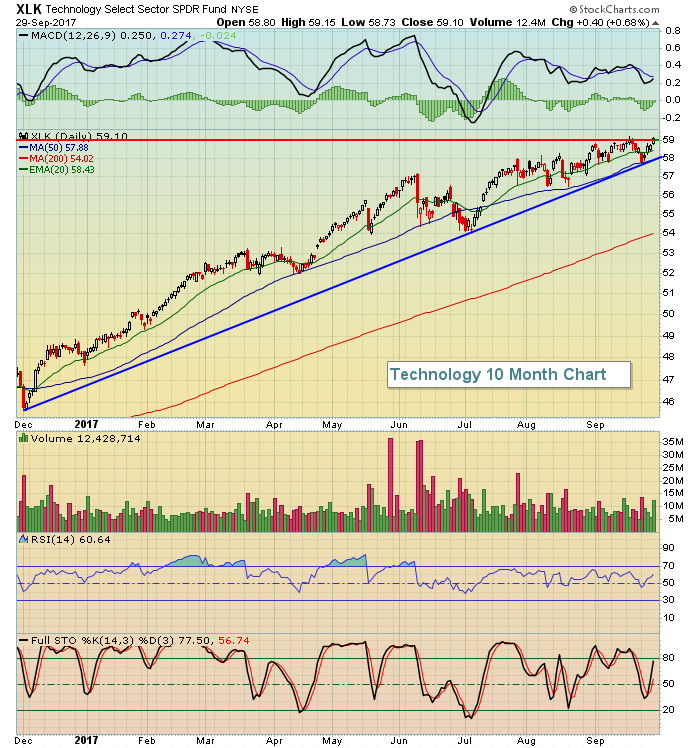
We wrapped up the third quarter on Friday with all-time highs showing up everywhere. There was a big buying push into the close on Friday, likely in anticipation of more strength during the fourth quarter. There was strength in most aggressive areas of the market with only utilities (XLU, -0.08%), consumer staples (XLP, -0.07%) and energy (XLE, -0.01%) finishing slightly in negative territory. Technology (XLK, +0.68%) was the leader as the group closed at an all-time high on Friday:
 A big reason for the strength in technology was bullish action in both internets ($DJUSNS) and semiconductors ($DJUSSC). The former is approaching a key breakout of its own:
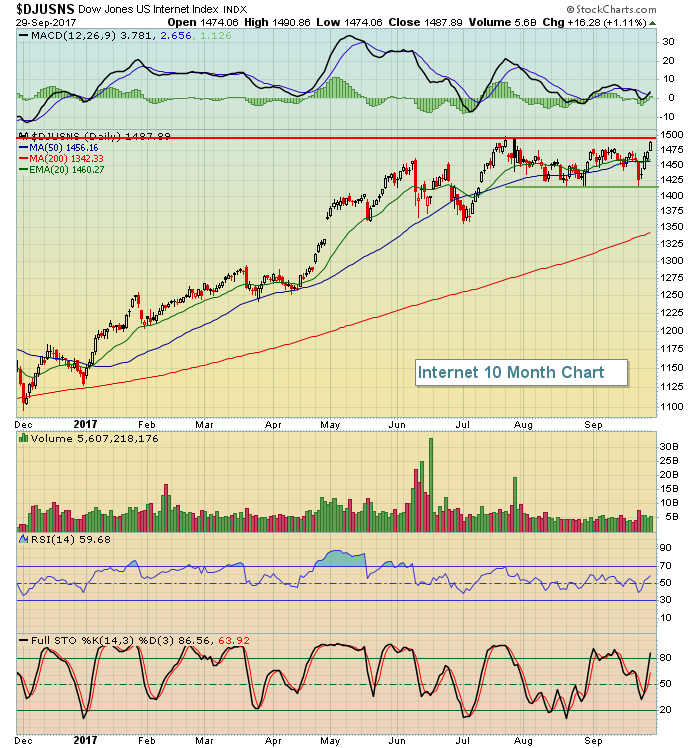 Further strength here would really add to the overall bullishness of the market, especially given the fact that the fourth quarter tends to be very kind to internet stocks.
Pre-Market Action
Crude oil ($WTIC) is taking a breather this morning, down over 1% at last check. That could weigh on energy shares today. However, the overall bullish bias remains as Dow Jones futures are higher by 35 points with 30 minutes left to the opening bell and the start of the fourth quarter.
Global markets rallied/are rallying as well. Overnight in Asia, we saw most key indices there finish in the green and European markets are following suit with most key indices there in the green as the U.S. market is set to open.
Current Outlook
The S&P 500 has once again finished in record territory and the daily MACD is turning higher to show accelerating bullish momentum as well. It's difficult to be bearish when multiple major indices are pushing to all-time highs, consumer stocks are behaving bullishly (rising XLY:XLP ratio), transports are again leading the charge and the more defensive areas like utilities (XLU) and consumer staples (XLP) are lagging badly. Here's the technical view currently:
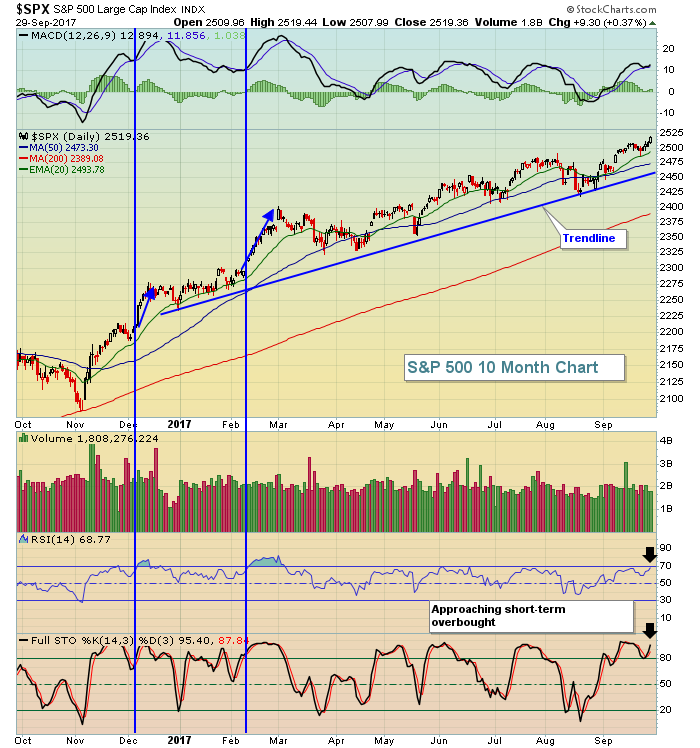 The only real negative technically right now is that we're nearly overbought on both RSI and stochastic. However, overbought can remain overbought during bull market advances. Two perfect examples are illustrated with the blue vertical lines above. The S&P 500 neared overbought territory in early December 2016 and again in February 2017. But we saw subsequent bullish action despite being overbought. In fact, the buying even accelerated while we were overbought. That's why I consider both RSI and stochastic to be secondary indicators. They let me know that the market is stretched, but they're not sell signals by themselves. A big reversing candlestick on the S&P 500 could corroborate those overbought signals. Until then, however, I'd be hard pressed to be anything other than bullish as our major indices move to all-time highs day after day.
Sector/Industry Watch
Apparel retailers ($DJUSRA) have awakened from a long period of underperformance. The group is acting much better technically and stocks within this space can be considered for trades on pullbacks. The first key will be to continue to hold rising 20 day EMA support. Failure to do so would be a red flag. Check out the recent action:
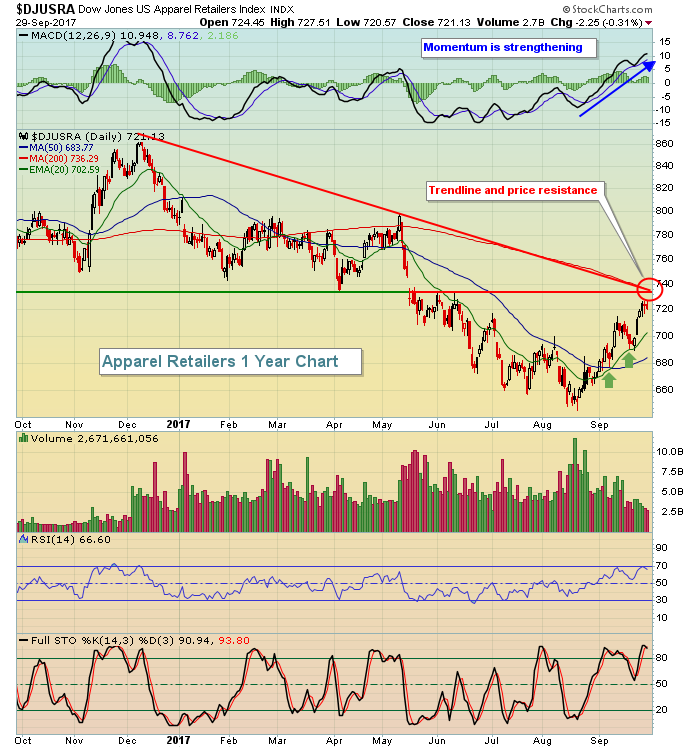 Volume was strong coming off the recent bottom, though it's been tailing off of late. I'd like to see a breakout above both trendline and price resistance (red circle) and on solid volume. That would really begin to change the technical picture on retailers. Until then, watch that rising 20 day EMA to provide short-term support.
Monday Setups
I like Edwards Lifesciences (EW) at the top of gap support. EW reported excellent quarterly results in the past two quarters. Since its last report, it's traded mostly lower and has returned to a key gap support level established from its earnings announcement in late April. Here's the chart:
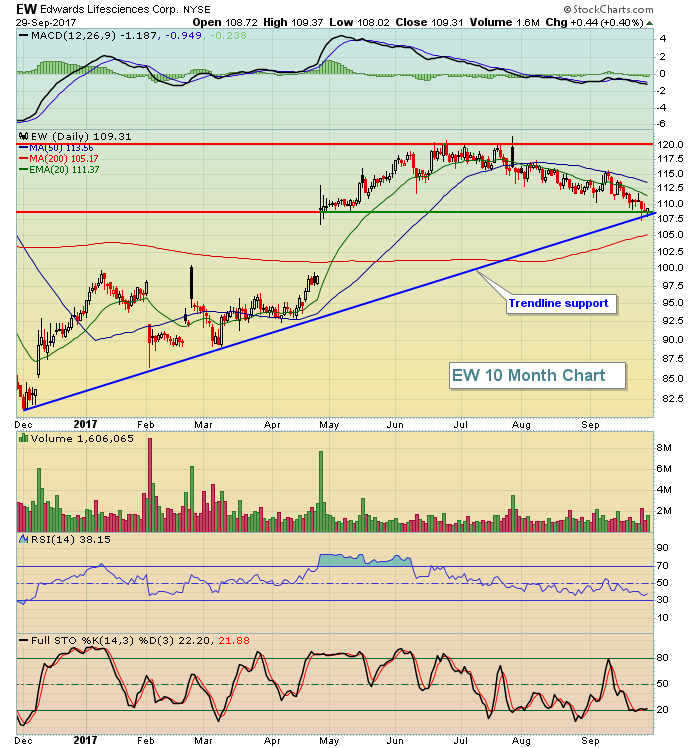 EW has set up nicely from a reward to risk perspective. I'd consider a target near 120 to test the high established after the last earnings report was released. To the downside, I'd consider the 107.00-107.50 to be a very solid support level and a closing stop. I'll discuss this setup and several others during MarketWatchers LIVE, which will be broadcast from noon to 1:30pm EST. You can sign in up to 15 minutes before the show begins RIGHT HERE.
Historical Tendencies
Since 1971 on the NASDAQ, the first trading day of all calendar months has risen 58.68% of the time and has produced an annualized return of +28.97%. Thus far in 2017, the first trading day of the calendar month has produced 7 gains, 2 losses and an annualized return of +105.70%.
Key Earnings Reports
None
Key Economic Reports
September PMI manufacturing index to be released at 9:45am EST: 53.0 (estimate)
September ISM manufacturing index to be released at 10:00am EST: 58.0 (estimate)
August construction spending to be released at 10:00am EST: +0.3% (estimate)
Happy trading!
Tom


