Market Recap for Friday, October 13, 2017
There are plenty of superstitious folks out there, but apparently the majority of stock traders don't fall under that umbrella. U.S. equities again rose on Friday with the Dow Jones, S&P 500 and NASDAQ all climbing to all-time intraday highs. Only the NASDAQ, however, was able to finish with a record high close. The small cap Russell 2000 failed to join its larger cap counterparts in record territory as this index battles extremely overbought conditions and its tendency to struggle during the first half of October.
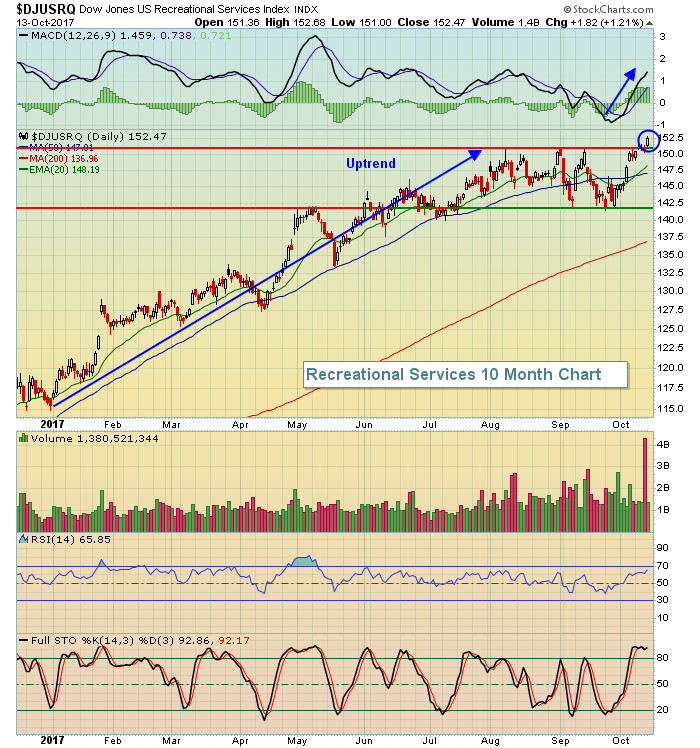
It was another mostly boring day of rotation between sectors and industry groups as five sectors advanced while the other four declined. Leading areas included consumer discretionary (XLY), technology (XLK) and materials (XLB), all of which gained 0.48% on the session. Recreation services ($DJUSRQ) was the best performing area of discretionary, gaining 1.21%, and that strength resulted in a breakout:
 Not all industry groups were higher, though, and I've featured one area of discretionary that's seen some profit taking lately in the Sector/Industry Watch section below.
Trailing the action on Friday was the defensive utilities sector (XLU, -0.70%). Normally, utilities tend to move in tandem with the defensive treasuries market. On Friday, however, treasuries were embraced while the XLU experienced a little profit taking.
Pre-Market Action
Gold ($GOLD) broke its one month downtrend channel last week and now looks to follow the defensive treasuries higher (see TLT chart below in Current Outlook section). GOLD is up a couple bucks in early action this morning. Light crude oil ($WTIC) is up 1.55% at last check to $52.25 per barrel. The WTIC's highest close since mid-April is $52.22 so a breakout today could buoy the energy sector back into a leadership role after stumbling a bit last week.
Asia was mostly higher overnight and Europe is enjoying fractional gains this morning. That global strength, though minor, has lifted U.S. futures as Dow Jones futures are higher by 22 points with a little more than 30 minutes left before the opening bell.
Current Outlook
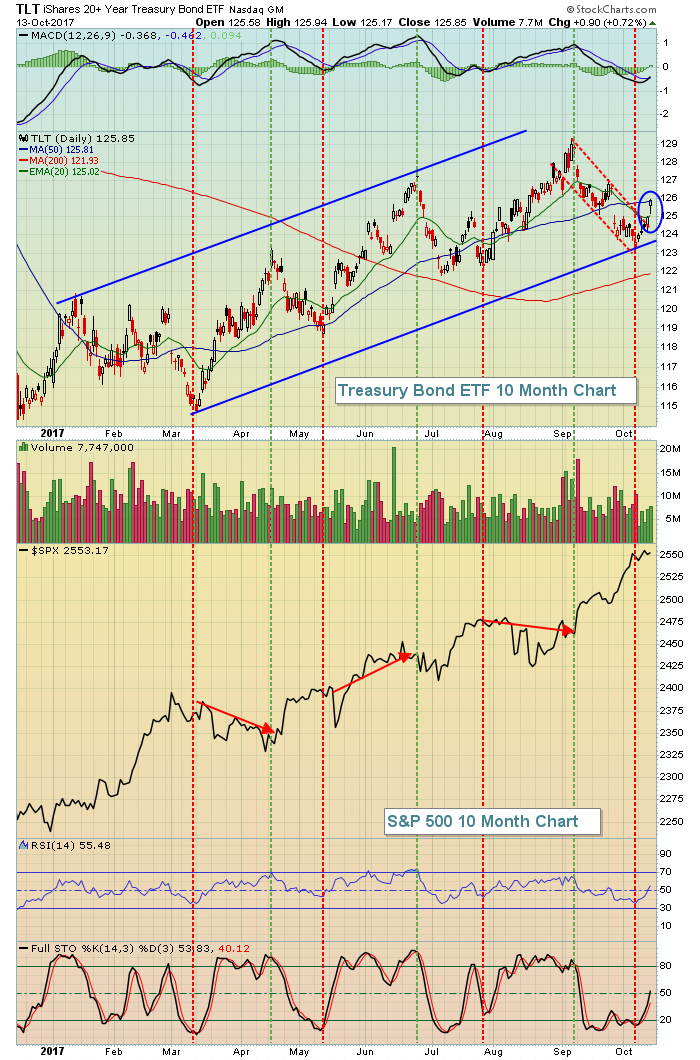
While our major indices mostly enjoyed more record highs on Friday, there was one "fly in the ointment". The iShares 20+ year treasury bond ETF (TLT) has been trending higher throughout 2017 and has appeared to break out above channel resistance the past couple days:
 The red dotted vertical lines mark the beginning of uptrends in the TLT and you can see that performance on the S&P 500 during those uptrends is generally not very good. The green dotted vertical lines mark the beginning of downtrends in the TLT (rising treasury yields) and that selling of treasuries has resulted in huge upswings in the S&P 500. So the fact that we've seen a breakout of the current downtrend in the TLT suggests that we grow a bit more cautious on the S&P 500 near-term. I remain bullish, but my expectations for a significant rally from here are lower - at least until we see the up channel in the TLT break down.
Sector/Industry Watch
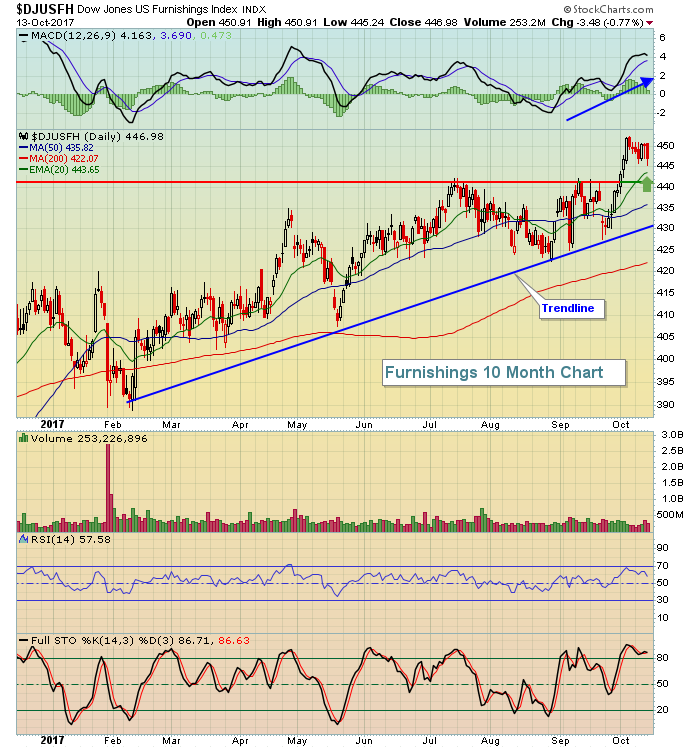
Consumer discretionary (XLY) has seen its bullish momentum accelerate recently and Friday's bounce off of rising 20 day EMA support further illustrated that renewed strength. On the surface, furnishings ($DJUSFH) lackluster performance on Friday seemed odd, but keep in mind that this group's breakout earlier this month helped to fuel the XLY's rise. Currently, the DJUSFH is simply taking a break as money rotates to other parts of discretionary. The DJUSFH chart looks solid:
 The green arrow marks the rising 20 day EMA, which would be the first key level of support, followed by price support just above 440. The longer-term uptrend is highlighted by the trendline support that's been holding throughout 2017.
Monday Setups
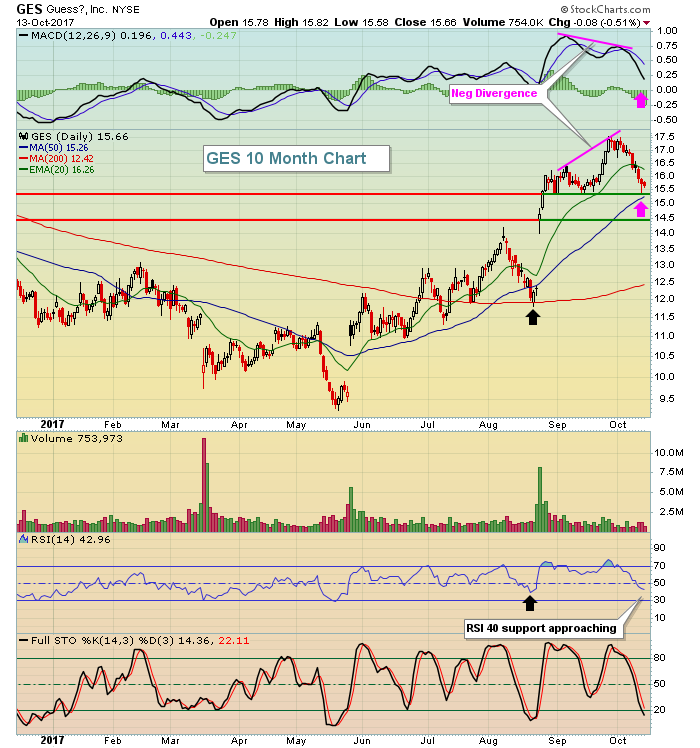
Every Monday morning, I provide a number of potential trade setups that you can find HERE. I post one candidate here and this week I'm going to feature Guess?, Inc. (GES):
 There was a negative divergence in play so I expected to see some weakness. Many times, a negative divergence is rectified with a test of MACD centerline support and 50 day SMA support. We're approaching both levels. Also, price support on GES has been solid in the 15.40-15.50 area. Should this support level break, look to the top of gap support closer to 14.50 for major support.
It also should help that GES performs its best historically from November through February. The seasonal pattern is evident by the average monthly gains over the following months during the past two decades:
November: +2.3%
December: +1.5%
January: +5.5%
February: +3.9%
Historical Tendencies
October performance for small caps (Russell 2000) since 1987 has been odd, to say the least. Here is a breakdown as to annualized performance during this month:
October 1-15: -15.03%
October 16-31: +24.81%
That latter half of October is particularly interesting because October 22nd through 27th has produced horrible results - an annualized return of (MINUS!) -45.57%. So obviously October 16th through 21st and October 28th through 31st are very bullish periods for the Russell 2000. That strength normally accelerates into November and December.
Key Earnings Reports
(actual vs. estimate):
SCHW: .42 vs .41
(reports after close, estimate provided):
CE: 1.92
NFLX: .32
Key Economic Reports
October empire state manufacturing survey released at 8:30am EST: 30.2 (actual) vs 20.0 (estimate)
Happy trading!
Tom


