Market Recap for Friday, November 10, 2017
Generally speaking, I'm not a big fan of defensive areas leading the market to the upside. But I'll make an exception for last week. Consumer staples (XLP, +1.02%) was not only the clear leader on Friday, but it's weekly gain of 2.15% also easily vaulted the XLP into a leadership role for the week. Why was the XLP's strength last week so important? Well, first take a look at the weekly chart:
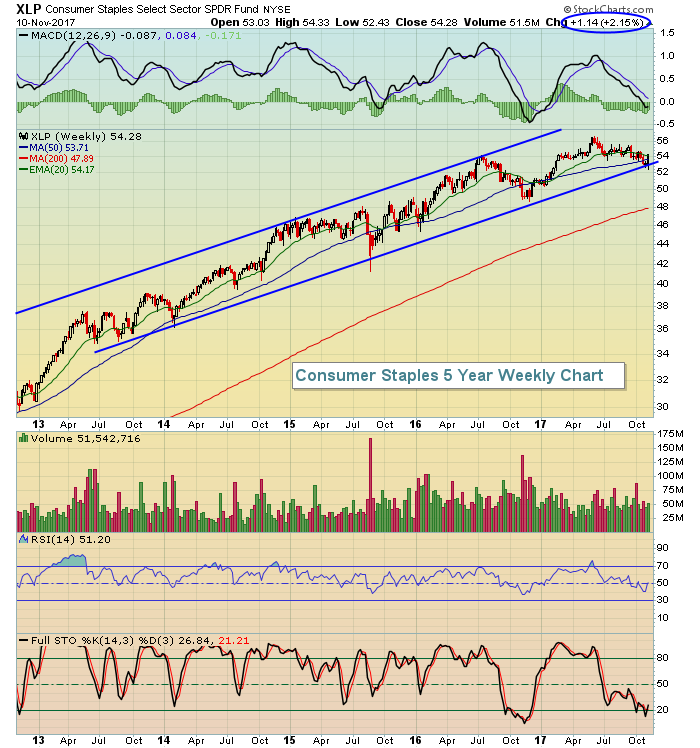 Trend lines can be drawn in many different ways to support an argument so I do take them relatively lightly. There are a couple of undeniable facts, though. First, the XLP clearly remains in an uptrend, a series of higher price highs and higher price lows. That's the definition of an uptrend. Second, I find channels to be more impressive than a simple uptrend line and it's fairly easy to visualize the channel that the XLP has been in the past several years. Finally, weekly RSI 40 tends to provide excellent support during periods of rising prices. Note that significant bottoms occurred as weekly RSI hit, or fell just beneath, the 40 level in both 2015 and 2016. Last week, the weekly RSI once again tested that critical 40 area and we saw a bullish price reaction once again.
The movement into consumer staples also helped to keep the bull market alive and kicking at a time when financials (XLF) and industrials (XLI) lost 2.61% and 1.07%, respectively, on a weekly basis. On the surface, this rotation from aggressive areas to a defensive one might be construed as a very bearish development. But keep in mind that sector rotation is very healthy in a bull market to keep the benchmark S&P 500 in a rising uptrend. If a month from now, we're still talking about money rotating from aggressive sectors to defensive sectors as the S&P 500 moves to all-time highs, then we might have a problem on our hands. For now, however, I consider the action to be quite bullish.
Both financials and industrials were somewhat bearish short-term because of a negative divergence, which is indicative of slowing price momentum. In other words, both of these sectors were overbought and due for a rest, so we shouldn't be shocked that they've received it. Here's a look at financials and how the MACD has nearly reset as price has approached its 50 day SMA:
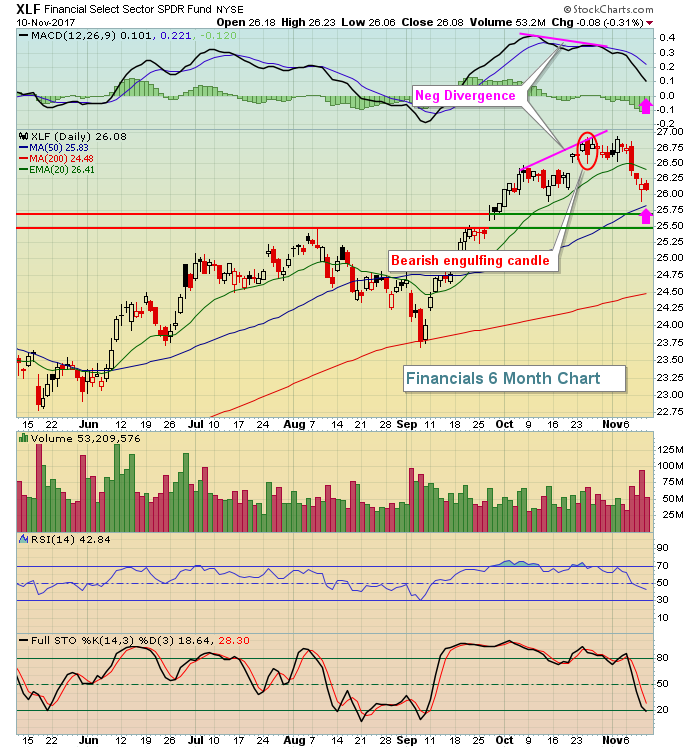 While it's possible that we see the XLF drop another 1-2% to test its gap support zone and fully reset its MACD (pink arrow), it's also just as likely that we see the XLF resume its prior uptrend, especially with the 10 year treasury yield ($TNX) showing strength to close out last week.
Pre-Market Action
The 10 year treasury yield ($TNX) has stabilized this morning and is down slightly after its surge late last week broke a recent downtrend in yields. Crude oil ($WTIC) continues to hover near $57 per barrel. Asian markets were mixed overnight, but the selling in Europe this morning is quite apparent. This marks the fifth day in a row where we've seen the German DAX ($DAX) struggle, but 13000 should provide some price support.
U.S. futures are set to follow the lead of Europe with Dow Jones futures pointing to a 75 point drop with 30 minutes left to the opening bell.
Current Outlook
The chart below highlights the connection between the direction of the 10 year treasury yield ($TNX) and the direction of financial shares:
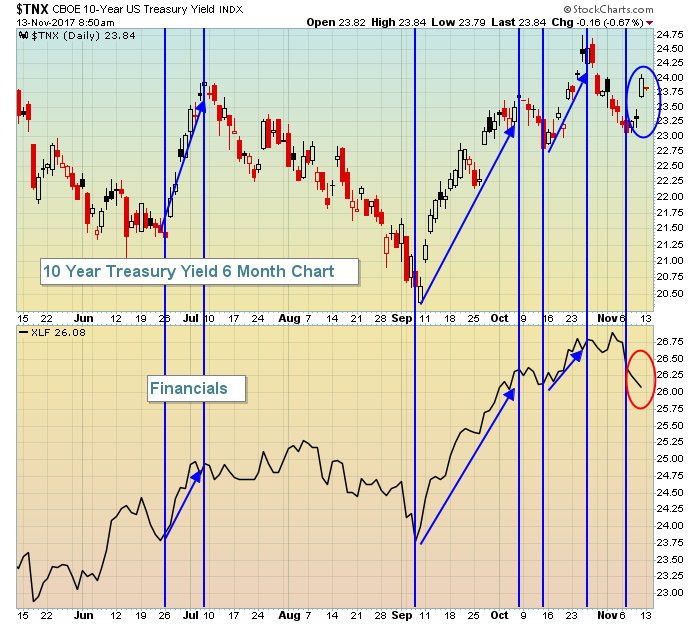 While the correlation isn't perfect, rising treasury yields tend to coincide with rising financials. The strength is usually most apparent in banks ($DJUSBK), life insurance ($DJUSIL), investment services ($DJUSSB) and asset managers ($DJUSAG). The blue vs. red circle shows that late last week, the TNX reversed course, but we didn't see a similar reversal in financials. However, given that the slowing momentum issue (negative divergence) is nearly resolved, I'd expect to see a resumption in bullish financial action sooner rather than later. Many financial stocks appear poised for a recovery after taking the past couple weeks off.
Sector/Industry Watch
Below you can see the weakness that banks ($DJUSBK) have experienced since printing an ugly negative divergence to open up November:
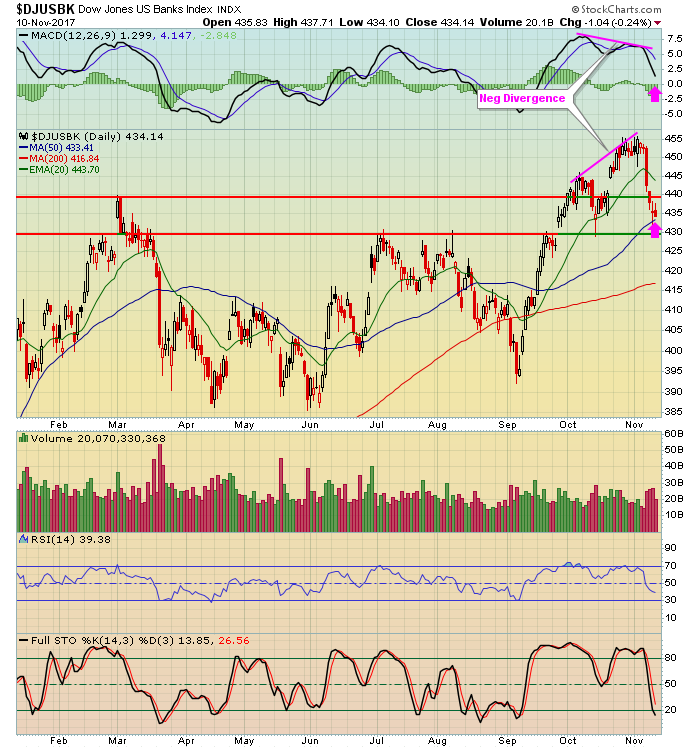 But now the reward to risk favors the bulls after watching that RSI drop back near 40. Price and gap support reside in a 430-440 zone and this is the area where I'd expect to see the banks turn higher - especially given the strength in the TNX late last week.
Monday Setups
Every Monday, I provide a number of potential trade setups and you can see the 11 from this week (and setups from the past couple weeks) by CLICKING HERE.
The stock I want to feature, however, is PACCAR (PCAR). It's in a very strong industry group, a group that's home to Caterpillar (CAT), Manitowoc (MTW), Terex (TEX), Oshkosh (OSK) and Allison Transmission (ALSN), among others. PCAR hasn't been one of the strongest performers in the group, but did recently breakout on its weekly chart and then pulled back to test its rising 20 week EMA on Friday. I like it because it's returned to a key area of price support and Fibonacci support and with an RSI reading of 40:
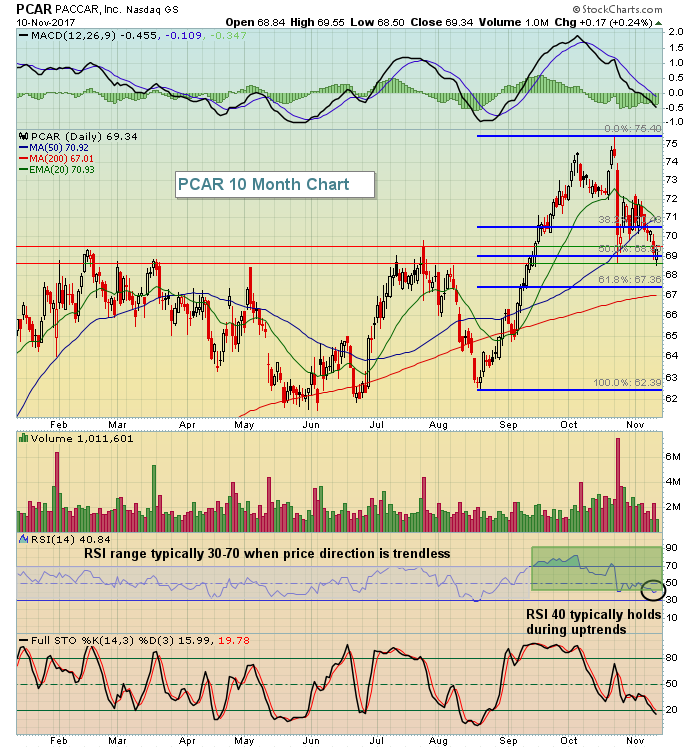 Friday's low cleared the low established on the heavy volume post-earnings day trading, but buying took over and PCAR held that support. Friday's low of 68.50 is now important technically - I definitely would not want to see a close beneath that level. PCAR's quarterly earnings report was quite solid with both revenues and EPS (1.14 vs 1.09) beating Wall Street estimates. The stock, though, had climbed 20% in the 8-9 weeks leading up to the earnings report so I believe it was a "buy on rumor, sell on news event". Now that price has retreated to an area of price support and has hit the Fibonacci 50% support level, I'm looking for price recovery. A tight stop beneath 68.50 could be considered while recent highs in the 75 area would provide a price target.
Historical Tendencies
Since 1950, November and December have been the two best months for the S&P 500. December has been the best month, having produced annualized returns of 19.51%. November is the second best month, producing annualized returns of 18.19%. Since 1971, the NASDAQ has outperformed the S&P 500 during both of these months, but the best calendar month for the NASDAQ has been January.
Key Earnings Reports
(actual vs. estimate):
JD: .23 vs .10
TSN: 1.43 vs 1.38
Key Economic Reports
None
Happy trading!
Tom


