Market Recap for Monday, November 27, 2017
We saw bifurcated action in the major indices on Monday as the Dow Jones tacked on another 23 points after nearly closing above 23600 for the first time ever. Instead, the bulls had to settle for an all-time intraday high of 23638.92. The other indices also saw afternoon weakness, but in their case, it resulted in losses by the close. There was no panic, however, as the S&P 500 lost just one point and did manage to close above 2600 for a second consecutive session.
Utilities (XLU, +0.43%) led the advance after bouncing nicely off the rising 20 day EMA. That's important technically as the recent MACD high suggests the XLU has accelerating bullish momentum. Rising MACDs normally suggest successful 20 day EMA tests and, as you can see below, that's exactly what we've seen with the XLU:
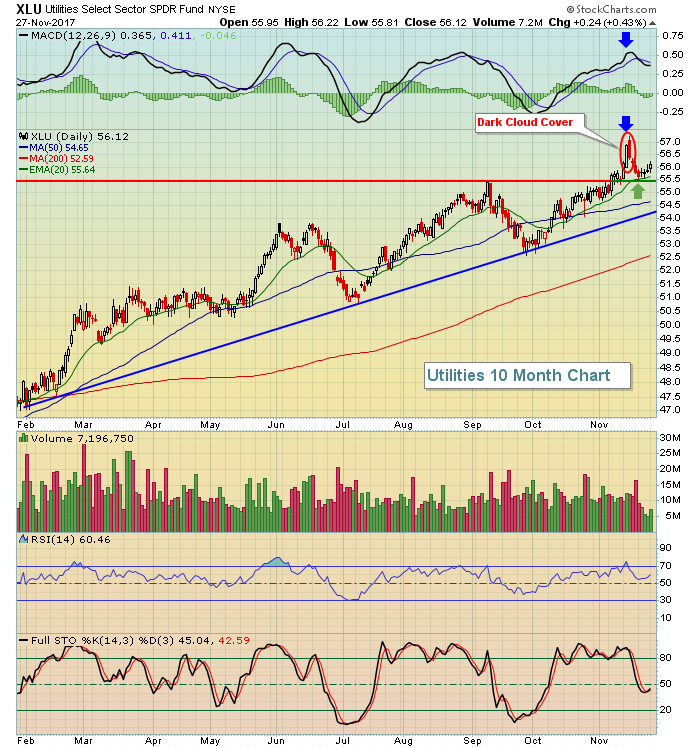 The blue arrows show the recent price high, with an accompanying fresh high on the MACD. That's what you want to see as it means that the short-term moving average (12 day EMA) is accelerating faster than the longer-term moving average (26 day EMA). Then we saw a short-term reversing candle (dark cloud cover) print and the XLU fell as expected. The weakness didn't last long, though, as buyers stepped back in on that 20 day EMA test.
Energy (XLE, -1.02%) was the weak link, dropping back close to fairly significant price support in the 66.50-67.00 area.
Pre-Market Action
Treasury bonds and gold are mostly flat this morning, while crude oil ($WTIC) is down slightly to $57.69 per barrel. The WTIC is now stuck in a short-term trading range from $55-$59 per barrel.
Asian markets were relatively flat overnight, but we're seeing some strength in key markets in Europe. That latter strength has resulted in higher futures here in the U.S. with Dow Jones futures up 44 points with 30 minutes left to the opening bell.
Current Outlook
Transportation stocks ($TRAN) have seen their weekly MACD remain above centerline support for more than a year, but that longer-term strength has been tested of late with short-term selling. I'm of the opinion that the longer-term chart will prove to be more reliable with transports regaining strength into year end. Their initial test is underway with hesitation at the declining 20 day EMA:
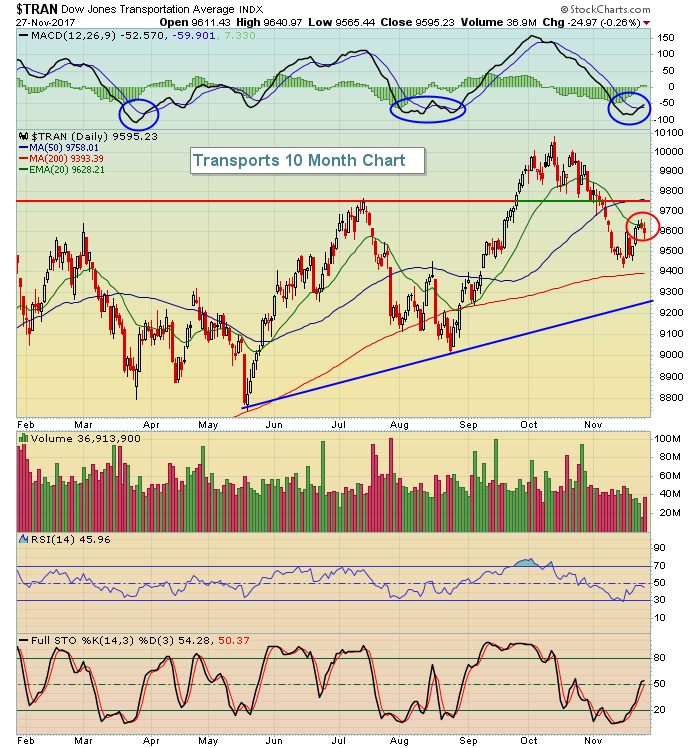 The blue circles highlight that this is the MACD level where we've seen strength return in transports. The red circle shows the hesitation to clear 20 day EMA resistance. We might see one more brief decline in the TRAN to set up a positive divergence similar to the low in August, though that isn't a guarantee. My guess is we're at or very close to a bottom in this area of the market.
Sector/Industry Watch
The Dow Jones U.S. Defense Index ($DJUSDN) appears to have completed its period of consolidation and seems poised for yet another push higher. In mid-October, the DJUSDN became very overbought, but those overbought conditions were relieved by five weeks of sideways to down action as its RSI fell from 80+ to 40. It was bull market rotation at its finest. The chart looks quite similar to the March/April period, just before its continuing ascent:
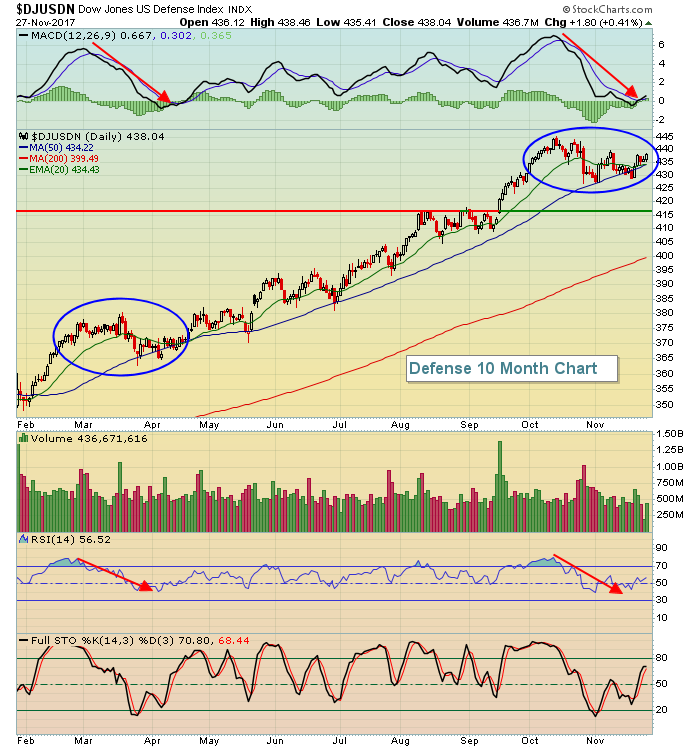 The blue ovals highlight very similar paths once RSI levels reached 80. We saw weeks of selling/consolidation until the RSI was unwound back to 40 and the stretched MACDs fell back to centerline support. Now that the DJUSDN has gone through a period of rotation away from the group, now I'd look for money to return into the group.
Historical Tendencies
Since 1950, the two best calendar months on the S&P 500 have been December and November, which have produced annualized returns of +19.51% and +18.19%, respectively. The third best month? April (+17.06%).
Key Earnings Reports
(actual vs. estimate):
BNS: 1.32 vs 1.32
(reports after close, estimate provided):
ADSK: (.13)
MRVL: .33
Key Economic Reports
September FHFA house price index to be released at 9:00am EST: +0.6% (estimate)
September Case Shiller index to be released at 9:00am EST: +0.4% (estimate)
November consumer confidence to be released at 10:00am EST: 124.5 (estimate)
Happy trading!
Tom


