Market Recap for Wednesday, November 8, 2017
It was another day of records for most of our major indices with the Dow Jones, S&P 500 and NASDAQ all closing at their highest levels ever. Consumer staples (XLP, +1.09%) led the advance and I feature this group in the Sector/Industry Watch section below, showing how it's recovered nicely following a recent breakdown in price action.
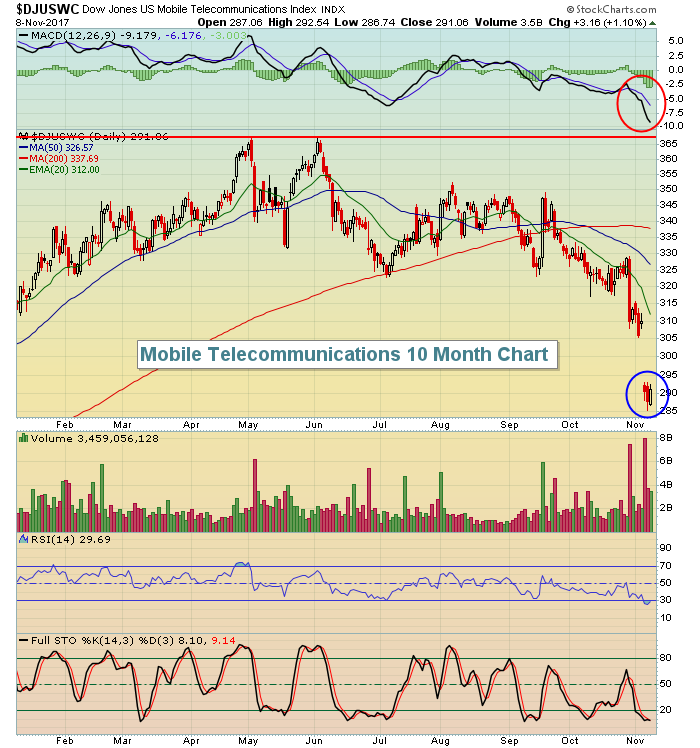
Technology (XLK, +0.55%) also had a very nice session with mobile telecommunications ($DJUSWC, +1.10%) among the strongest industry groups on Wednesday. The DJUSWC really needed a day like this as it's been mostly straight downhill since the group printed a double top in May/June:
 Two things are worth noting here. First, note that the price momentum (MACD) is very bearish so any bounce will likely be just that - a bounce. Second, there's the potential for a island cluster reversal (blue circle) off this downtrend, but we'll need to see a gap higher to confirm the pattern. Should we get one, I'd look to the declining 20 day EMA as key price resistance during a countertrend rally.
Financials (XLF, -0.49%) and energy (XLE, -0.48%) saw some profit taking on the session, with that latter sector certainly deserving a rest after another solid breakout earlier this week.
Pre-Market Action
Asian markets were mixed overnight, but weakness in Europe, especially Germany, is carrying over into U.S. futures this morning. The German DAX is down 1.10% at last check and Dow futures are currently down 88 points with approximately 40 minutes left to today's opening bell. There's nearly double that weakness on NASDAQ futures.
Kohls (KSS) reported disappointing quarterly results and there's a dark cloud over the retail space this morning as a result. KSS, however, has traded 12-13% lower over the past several weeks, suggesting that this earnings disappointment was on the way. Retail stocks have been laggards for months, so I expect this news to blow over rather quickly.
Current Outlook
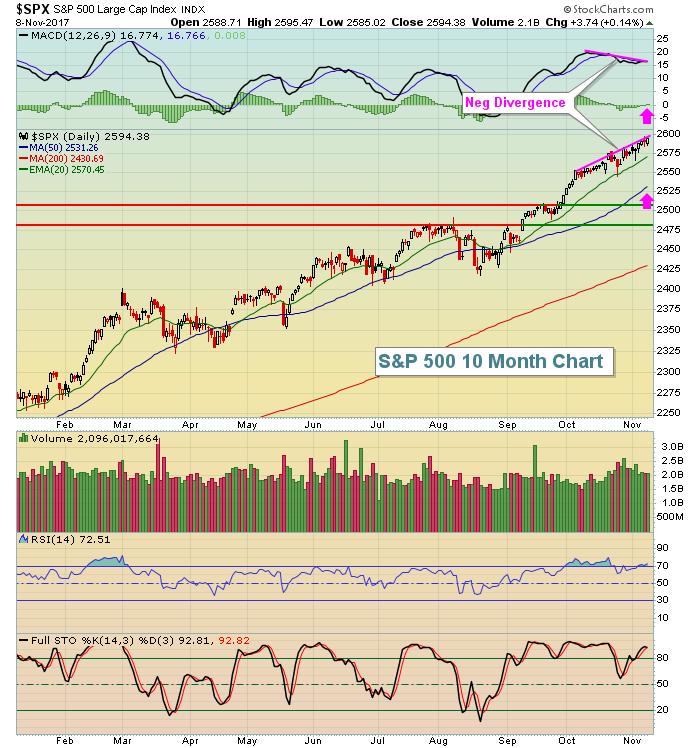
Price momentum on a weekly basis remains quite strong, suggesting this bull market remains on very solid footing. But....we're very overbought with weekly RSI of 78 on the benchmark S&P 500. That's the most overbought the weekly RSI has been throughout the current 8 year bull market. These weekly overbought conditions, along with a negative divergence on the daily charts tells me there's a considerable risk of a 2-3% drop on the horizon. We haven't seen that kind of drop since the first half of August. Here's the current picture on the S&P 500:
 Since our last breakout in late September, we've seen very little selling pressure. We did have one quick move lower to test the rising 20 day EMA during the latter part of October, but that's been it. Should the selling today accelerate, watch that rising 20 day EMA, currently at 2570. If that fails to hold, then I think the tables have turned in the near-term with the bears finally able to gain control of the action. The rising 50 day SMA is at 2531 and that would be the next key level to test. But ultimately, I'd move out to that weekly chart, understanding that rising 20 week EMA tests typically produce buying opportunities during a bull market. That level is at 2506. So, for me, the main support range is from 2506-2531, representing a potential 3.0-3.5% pullback to help unwind the overbought oscillators and possibly reset the daily MACD back to or near centerline support.
Despite the "potential" for short-term weakness and/or consolidation, I remain firmly bullish into year end and as we approach 2018.
Sector/Industry Watch
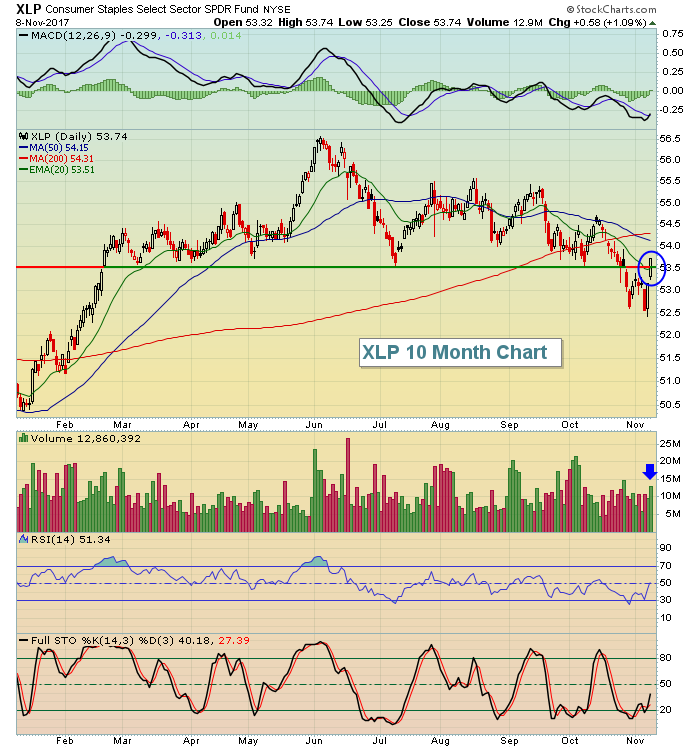
Consumer staples (XLP) had clearly been the worst performing sector over the past couple months, at one point breaking to eight month lows during a very strong overall bull market advance. It was a head scratcher, but the group seems to have righted the ship technically by clearing overhead price resistance and its declining 20 day EMA:
 Normally, after a breakdown and with the 20 day EMA declining rapidly, prices struggle to reclaim that 20 day EMA. That was not the case here and now the recent breakdown looks like a fakeout. It will be interesting to see how the XLP performs today with futures down sharply. A close back beneath the 20 day EMA muddies the technical picture.
Historical Tendencies
From a historical perspective and as a bull, the two days of the month to always be aware of are the 9th and 19th. These have been the worst two days of the calendar month over the past 67 years on the S&P 500. Here are their annualized returns since 1950:
9th: -19.68% (571 trading days in sample)
19th: -33.57% (564 trading days)
So why do these two days produce such bearish results? Well, the 9th falls within a period of profit taking (7th through the 10th) that follows typical stock market rallies that result from money inflows during the first week of the month. The 19th falls either on or very close to monthly options expiration (3rd Friday of every month). Prices have a history of rising between the 11th and 18th of calendar months and the 19th begins a period of profit taking that runs through the 25th. Many market makers likely have a vested interest in seeing equity prices move lower to squeeze out premiums on monthly options.
Key Earnings Reports
(actual vs. estimate):
AZN: 1.12 vs .57
DHI: .82 vs .82
DISH: .57 vs .60
JCI: .87 vs .87
MGA: 1.36 vs 1.34
NCLH: 1.86 vs 1.82
TDG: 3.48 vs 3.38
TU: .52 vs .53
(reports after close, estimate provided):
DIS: 1.12
NVDA: .94
Key Economic Reports
Initial jobless claims released at 8:30am EST: 239,000 (actual) vs. 232,000 (estimate)
September wholesale trade to be released at 10:00am EST: +0.3% (estimate)
Happy trading!
Tom


