Market Recap for Wednesday, November 29, 2017
One quick glance at the S&P 500's meager 1 point loss on Wednesday and you might assume that Wall Street meandered through another one of its boring days. But a deeper look will tell you that yesterday was anything but boring! Technology (XLK, -2.21%) was hammered and suffered its worst one day loss since June 9th and its second worst day of 2017. What happened? Well, first and foremost, a negative divergence had printed on XLK's recent breakout. That tells us that risk is heightened so you shouldn't be surprised by sudden selling. In fact, I'd expect to see more relative weakness over the next couple weeks, possibly a bit longer. That's my first takeaway from the action. I still love technology stocks, but yesterday's heavy volume selling suggests we'll see more volatility and lower prices ahead. Here's a reprint of the XLK chart that I posted in my blog yesterday:
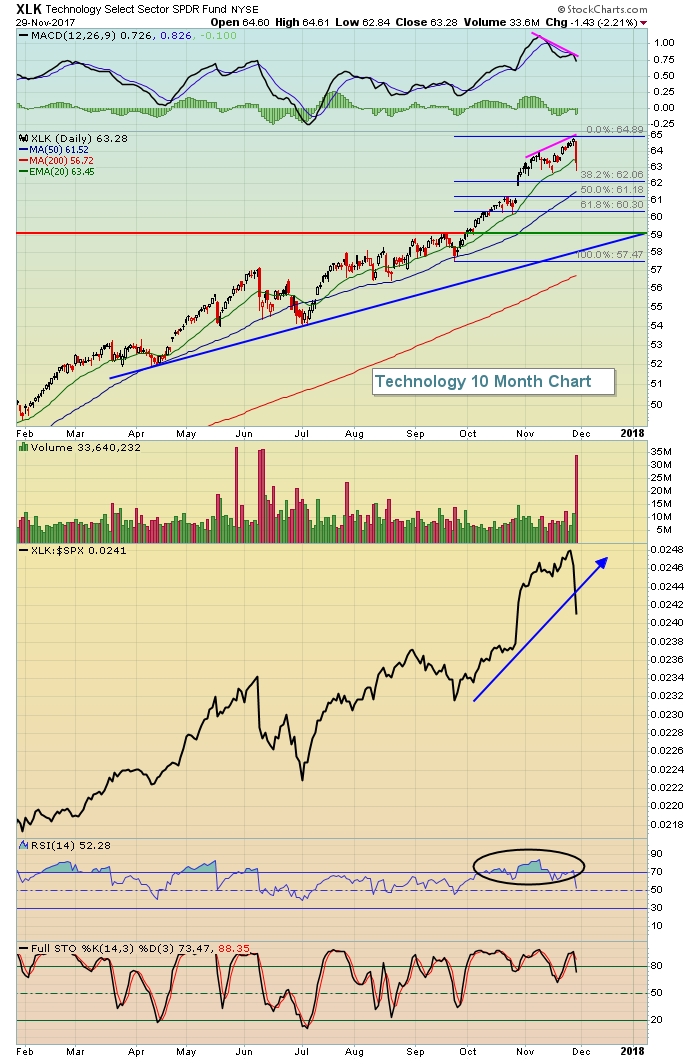 Negative divergences guarantee us absolutely nothing. However, slowing price momentum does tell us that risk is very high and there's the potential for exactly what we saw on Wednesday. Financials (XLF, +1.71%), industrials (XLI, +0.88%) and materials (XLB, +0.15%) all recently printed negative divergences on their daily charts and suffered through relative weakness for several weeks. It's technology's turn, it's as simple as that. I suggested yesterday before the market opened to consider at least selling partial positions in technology shares and I still feel the same way on any bounce. The type of selling we saw on Wednesday is typically followed by more selling and I suspect that'll be the case once again.
I think the chart below should help you visualize the massive rotation that took place yesterday:
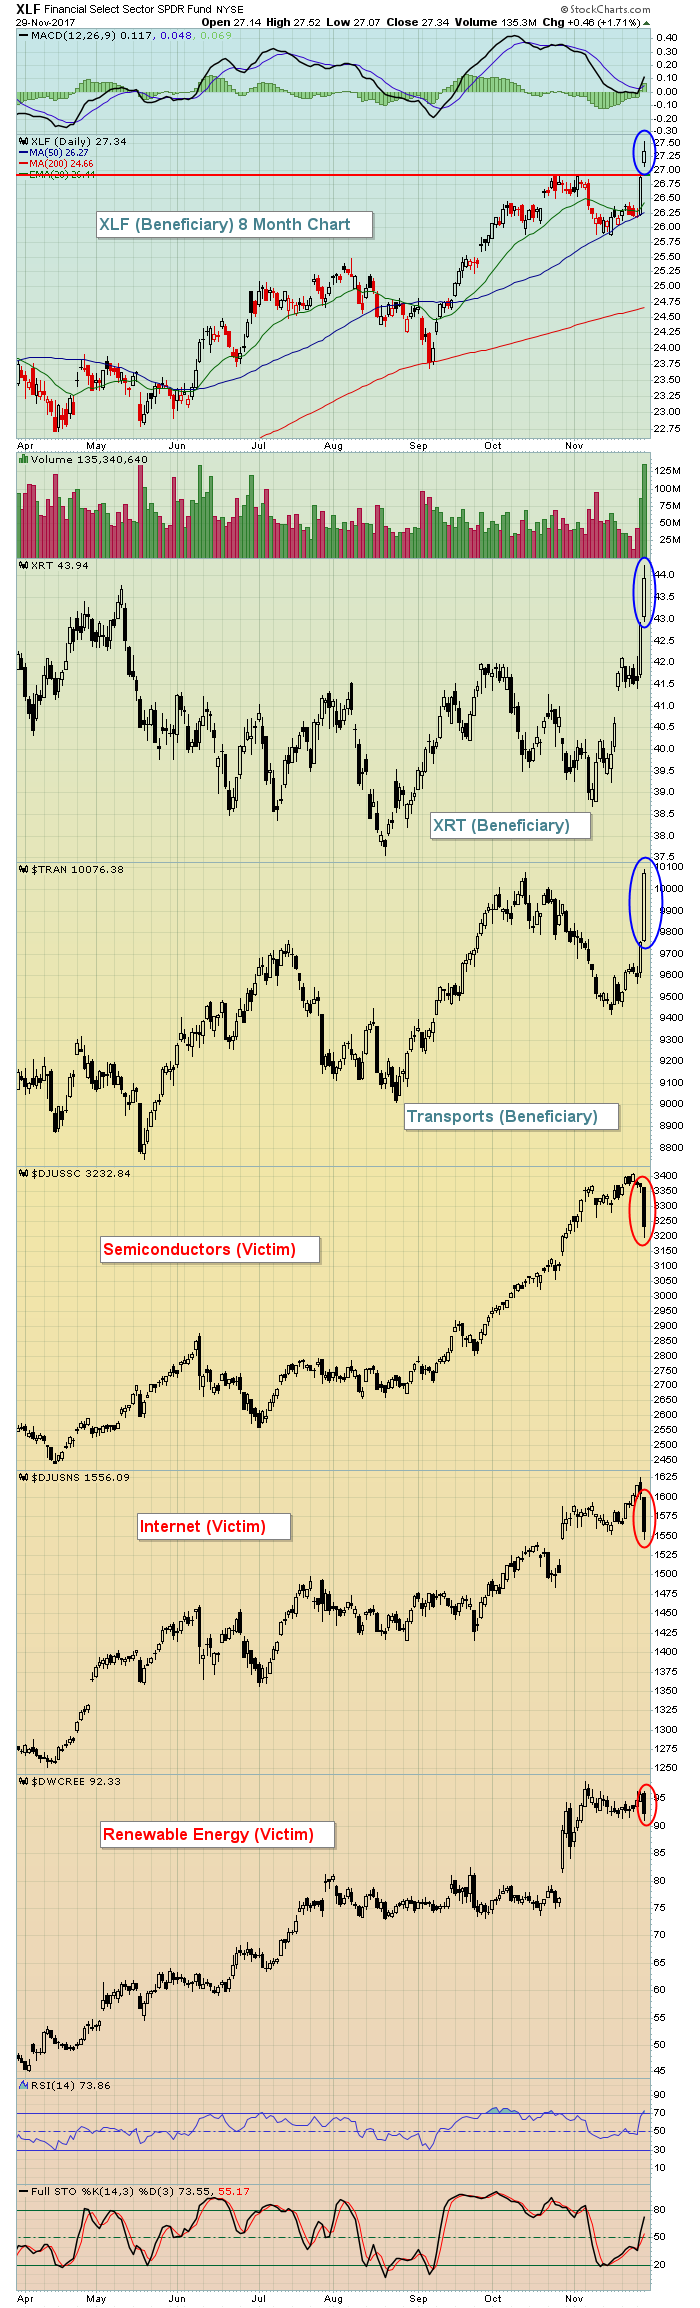 It's pretty clear that two technology high-flyers - semiconductors ($DJUSSC) and internet ($DJUSNS) - were the primary culprits of technology selling and both had been on parabolic-type runs to the upside. These types of advances can see very swift corrections as all those that entered these trades late panic and sell at any price after a blood bath. Great opportunities will present themselves later in December, but I think it's too early to trust a recovery in this group too soon.
Pre-Market Action
The 10 year treasury yield ($TNX) has tacked on another couple basis points above 2.39%. 2.40% is a short-term resistance level to clear with the really big yield resistance closer to 2.47%. Gold ($GOLD) is falling back this morning, unable to clear the $1300 level recently and crude oil ($WTIC) is regaining a bit of strength, up about three-quarters of one percent in early action.
The German DAX ($DAX) is leading European action this morning and Dow Jones futures are pointing to another record high, up 95 points with 30 minutes left to the opening bell.
Current Outlook
My second takeaway from yesterday is that the 10 year treasury yield ($TNX) broke above symmetrical triangle resistance. Why is that important? Well, there's a couple reasons. First, treasury yields moving higher means that treasury prices are moving lower. There is a 100% inverse correlation between treasury prices and treasury yields. Short-term moves higher in the yield mean more cash available (from selling of treasuries) to fuel quick pops in the S&P 500. The fact that money is rotating out of technology means there is a TON of cash moving into other areas of the market, namely financials and industrials. Financials, especially banks ($DJUSBK), see profits accelerate when treasury yields rise. Net interest margins are the key driver of banks EPS and those get a major boost with rising yields. As the TNX breaks out, check out the action in banks:
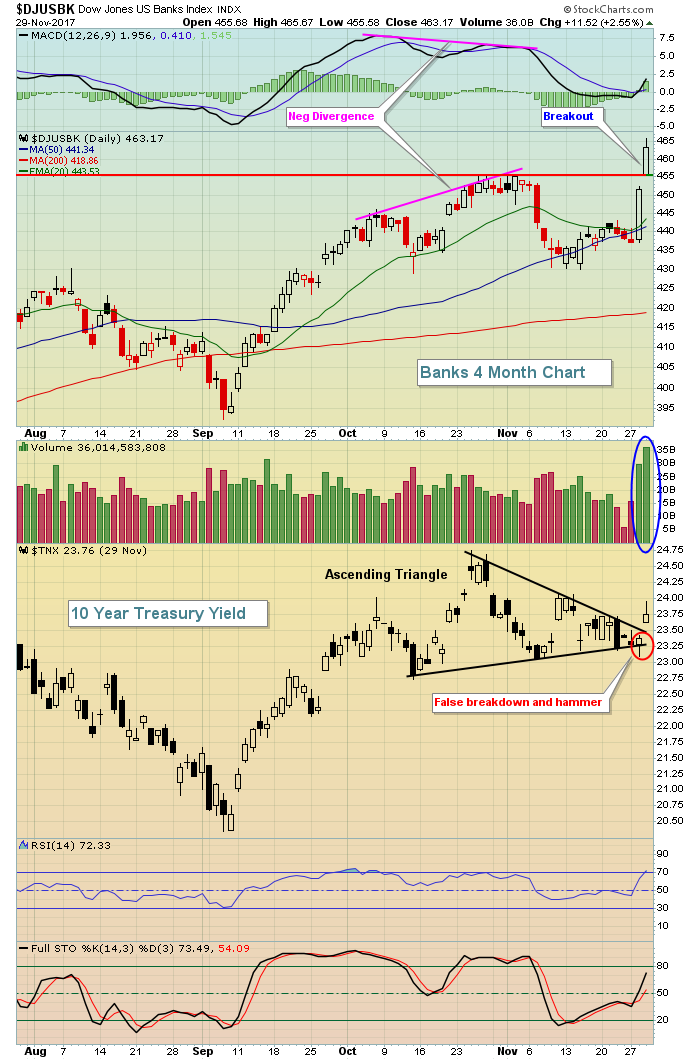 Banks showed signs of slowing price momentum in the form of a negative divergence at the price high in late October. That issue was resolved, however, as yields dropped, taking the DJUSBK back to its 50 day SMA and helping to "reset" the MACD at its centerline. Now that we've seen the TNX clear triangle resistance and we've seen billions of dollars rotating out of technology stocks, I'd fully expect to see a very strong rally in financial stocks. Banks and life insurance companies ($DJUSIL) should do particularly well.
Sector/Industry Watch
Retail. Retail. Retail. Wow, what a powerful move we've seen in this very influential consumer discretionary area! Consumer discretionary (XLY) languished relative to the benchmark S&P 500 for two years while retail struggled. Now that retail has broken its downtrend, I'd look for more strength in this area and leadership from discretionary stocks in general:
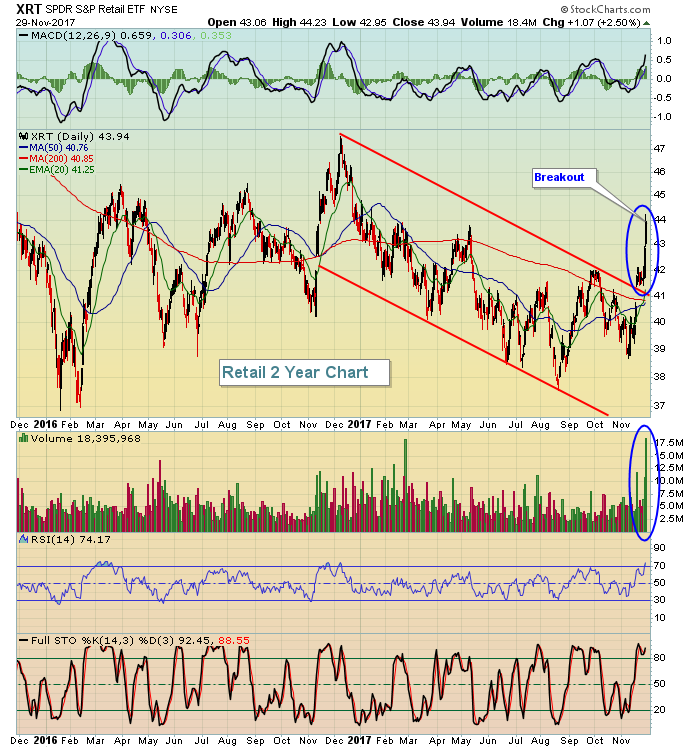 From 2009 through 2015, consumer discretionary led this bull market. Retail stocks zoomed higher faster than just about every area of the market. But market participants have short-term memories and only think of the weakness that we've seen in retail for the past couple year and can't comprehend the shift taking place in the market right now. I look for retail stocks to continue to outperform and aid the discretionary sector in a very meaningful way.
Historical Tendencies
Here's the third takeaway from Wednesday's action. Technology underperformed in a big, big way. It's likely setting the stage for December underperformance, which is typical for technology as you can see from the seasonality chart below:
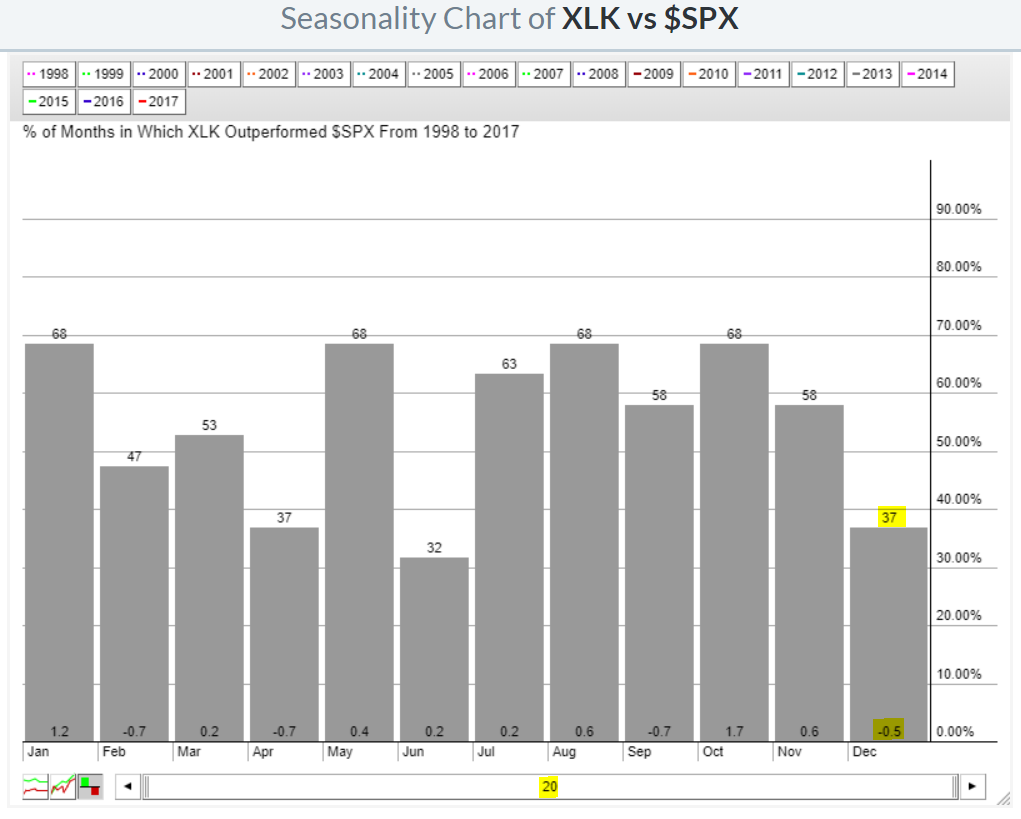 The highlighted "-0.5" under the December column means that the XLK has averaged underperforming the benchmark S&P 500 by one half percent over the last 20 years. So while December is one of the strongest months for U.S. equity performance, it's not normally from leadership in technology. Instead, check out those relative gains in October and November. Those are the two months where we normally see relative strength in technology and we just saw it again the past two months. Given the negative divergence present on the XLK's daily chart, I'd look for more overall weakness in the XLK in December, although there'll surely be bounces along the way.
Key Earnings Reports
(actual vs. estimate):
CM: 2.25 vs 2.05
KR: .44 vs .40
TD: 1.09 vs 1.11
(reports after close, estimate provided):
ULTA: 1.67
VMW: 1.27
Key Economic Reports
Initial jobless claims released at 8:30am EST: 238,000 (actual) vs. 240,000 (estimate)
October personal income released at 8:30am EST: +0.4% (actual) vs. +0.3% (estimate)
October personal spending released at 8:30am EST: +0.3% (actual) vs. +0.3% (estimate)
November Chicago PMI to be released at 10:00am EST: 63.5 (estimate)
Happy trading!
Tom


