Market Recap for Friday, December 1, 2017
An early selloff on Friday quickly became a buying opportunity as the bulls jumped back on board for what they hope will be another big upturn. All of our major indices ended the Friday session in negative territory, but the losses early in the day were much, much larger. The Dow Jones, for instance, was down 350 points a couple hours into the day, but recovered more than 300 of those points to finish down just 40.76 points. The tech-heavy NASDAQ was down an astonishing 137 points, or roughly 2%, before reversing and finishing 26 points lower.
Energy (XLE, +0.84%) led the rally as crude oil ($WTIC) again approached $59 per barrel. Since breaking above $55 per barrel, traders are bullish that this level of support continues to hold. Energy shares weathered the $40-$50 per barrel range over the summer and now with crude prices rising, energy stocks are following suit and attracting money rotating from other areas, namely technology (XLK, -0.52%). Technology was the only sector to lose ground last week (-1.53%) as market rotation finally takes its toll on the tech area.
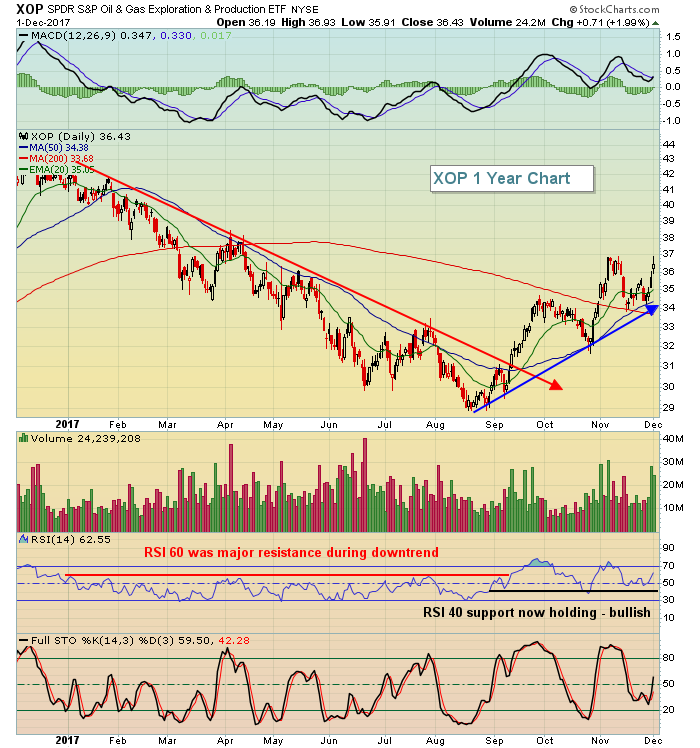
One proxy for oil exploration & production stocks (XOP) has clearly turned from a downtrending group to an uptrending one:
 RSI 60 resistance tends to provide a wall that the bulls cannot climb during downtrends, but once that reversal occurs and an uptrend begins, then we shift to a bullish wall of support near RSI 40. That's perfectly illustrated above.
U.S. stocks were initially shaken as National Security Advisor Michael Flynn pleaded guilty to lying to the FBI regarding contacts with a Russian ambassador to the U.S. It didn't help that there were uncertainties as to the passage of a tax reform bill in the Senate. But ultimately, buyers re-emerged and used the early selling as an opportunity to jump on the bull market train.
Pre-Market Action
Crude oil ($WTIC) is down in early action, as is gold ($GOLD), but U.S. futures are soaring on the approval of the tax bill. Also, a big merger is lifting spirits as well as CVS Health (CVS) has agreed to buy Aetna (AET) for $69 billion. That should help to boost the healthcare sector.
As we approach the start of a new trading week, Dow Jones futures are up 200 points.
Current Outlook
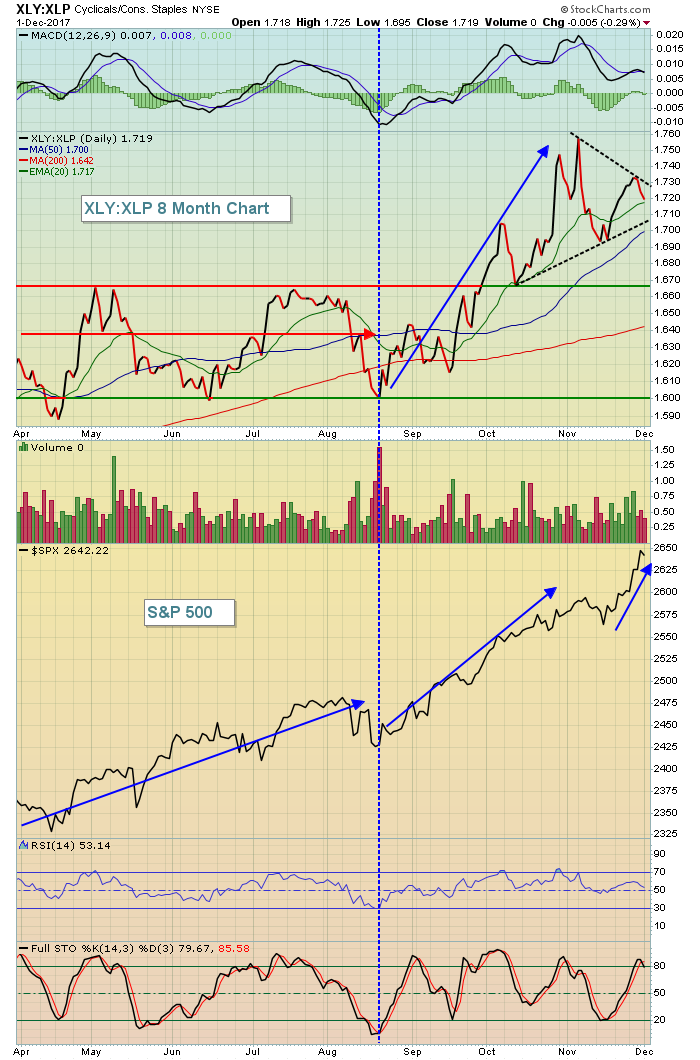
A favorite relative ratio of mine is the XLY:XLP, which shows the relative strength of consumer discretionary stocks (aggressive part of consumer stocks) vs. consumer staples stocks (defensive part of consumer stocks). I like to see this ratio uptrending to support and sustain a bull market advance. While we haven't seen a new high in this ratio since early November, it does appear to me that there's a bullish continuation pattern in play - symmetrical triangle:
 When you look at the above chart, you might grow a bit concerned that from April through August the benchmark S&P 500 continued rising to fresh new highs while the XLY:XLP ratio stagnated. But keep in mind the two don't need to go hand in hand. While the S&P 500 was rising, the XLY:XLP was consolidating in very bullish rectangular fashion. There was no breakdown and eventually in late August, consumer stocks performed exactly as we would expect - with discretionary trouncing staples as they did during September and October. As the S&P 500 took off in November, we again are watching the XLY:XLP ratio consolidate, this time in symmetrical triangle fashion. I view this ratio very bullishly and believe it indicates the sustainability of the current overall stock market advance.
Sector/Industry Watch
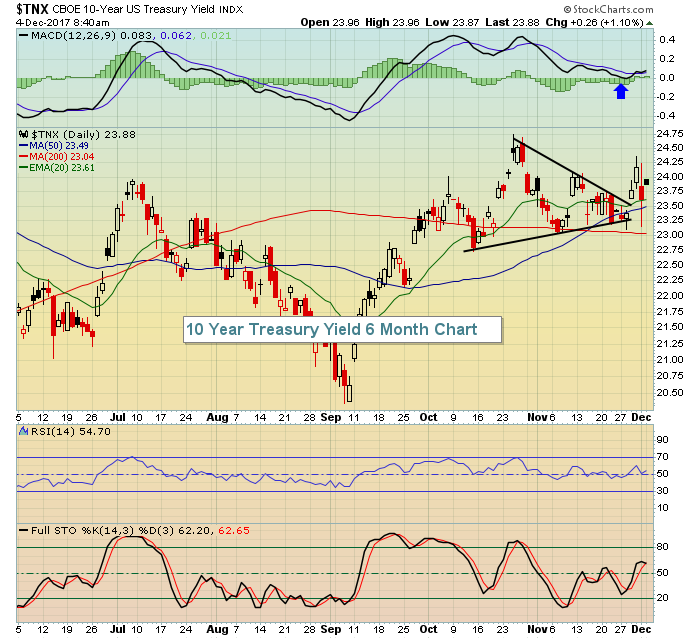
As money left the U.S. stock market in early action on Friday, it quickly found a home in the treasury market as traders were obviously nervous. However, just as the stock market reversed intraday, so did the bond market. Whiile it was an unnerving kind of day, the 10 year treasury yield ($TNX) did rally to easily finish above symmetrical triangle support:
 The range of the yield on Friday was from 2.32% to 2.42%, an extremely volatile day for the bond market. But by day's end, the TNX did settle above key support and that suggests the current uptrend remains in play. Traders were clearly buoyed by that development as the financial stocks rebounded from earlier losses to actually climb into positive territory. I expect financials to continue to lead the market into year end and 2018.
Monday Setups
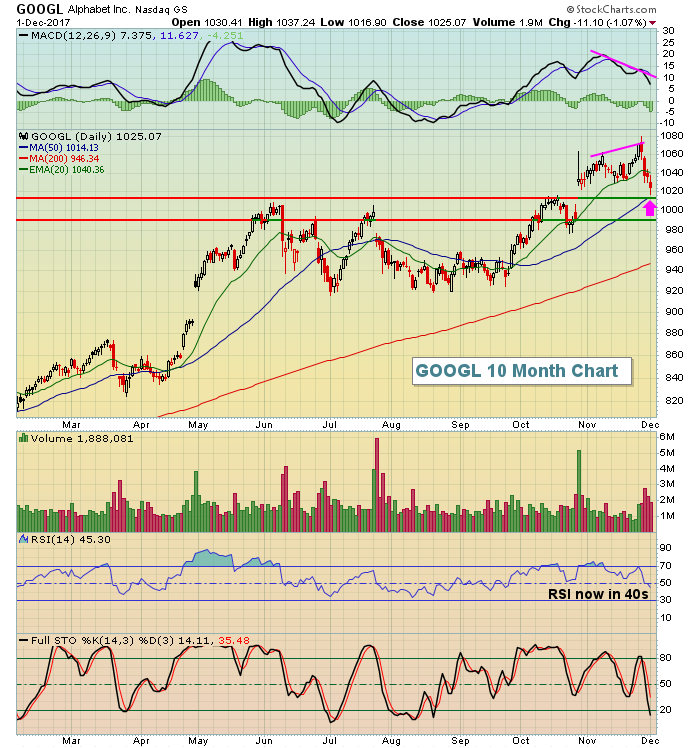
Every Monday, I provide trade setups to consider for the upcoming trading week. Today, I want to focus on a trading favorite - Alphabet (GOOGL). The stock had a very rough week last week, but now has hit price and gap support and has quickly approached 50 day SMA support. Check out the chart:
 GOOGL is another stock off of my strong earnings ChartList that I keep updated here at StockCharts.com. Many of you have asked me to share this ChartList. It's a lot of work to maintain this list so I'd rather share stocks that I like from it here in this blog and on the MarketWatchers LIVE show that I host Mondays through Fridays from noon to 1:30pm EST.
I do want to make you aware, however, that John Hopkins, President of EarningsBeats.com, did reveal in his ChartWatchers article over the weekend that he'll share his list (which is nearly identical to mine) as part of a holiday promotion. There's a small charge to get the list, but I think well worth it. If interested, you can CLICK HERE for more details.
Historical Tendencies
We remain in a very bullish historical period that runs through the 5th or 6th depending on which index we look at. There is an upcoming period, however, when stocks tend to suffer from profit taking. Here are the periods on each index and the annualized return (loss) for each:
S&P 500 since 1950 (December 11-15): -29.73%
NASDAQ since 1971 (December 9-15): -54.65%
Russell 2000 since 1987 (December 7-15): -43.46%
I'm not predicting a big selloff, just wanted to make you aware of this seasonal tendency.
Key Earnings Reports
None
Key Economic Reports
October factory orders to be released at 10:00am EST: -0.4% (estimate)
Happy trading!
Tom


