Market Recap for Monday, January 29, 2018
We saw something different in the U.S. stock market on Monday. We closed in negative territory on all of our major indices and we closed at or near lows for the day. There was little or no bargain hunting at the end of the session. So is that it? Have we come to the end of this bull market rally? Well, I'd say it's premature to start that dialogue, despite red futures this morning. We are dealing with some short-term negative divergences on our hourly charts, however, so we could be in for another day or two of selling to alleviate those very short-term momentum issues. Here's the short-term negative divergence on the Dow Jones:
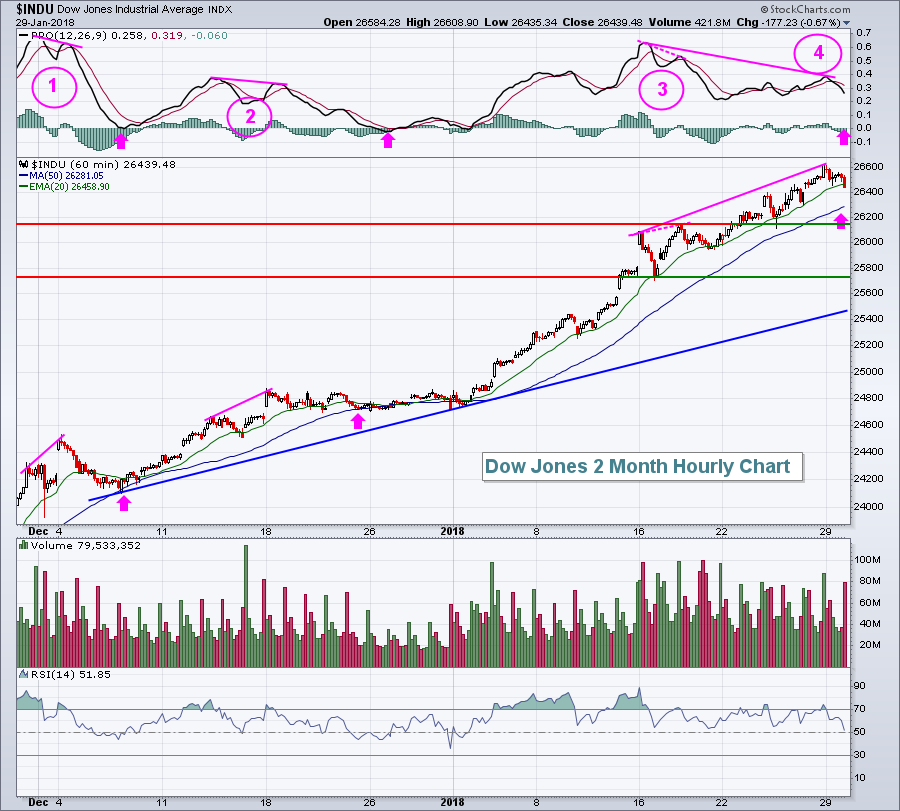 As we look back over the past couple months, we've seen negative divergences on 3 separate occasions. The first two worked as many do - with weakness taking price action beneath the 20 hour EMA down to test the 50 day SMA and with a subsequent PPO centerline reset. The third time, however, prices fell only to the rising 20 hour EMA and have continued to bounce higher. The problem is that this negative divergence hasn't gone away. We're still mired in it. This morning's weak futures will likely take the Dow Jones beneath its 50 hour SMA at the opening bell. I've drawn a couple of price support levels to watch for a reversal. Trendline support resides nearly 1000 points below Monday's close. While it's certainly possible we'll see weakness to test that trendline at some point, predicting that test at the first sign of price weakness is probably not a great idea - especially as we approach month end. (See Historical Tendencies section below for details of month end performance.)
The 10 year treasury yield ($TNX) finished its session Monday with a close of 2.70%, the highest level we've seen in 3 1/2 years. That continues to spark interest in financial shares (XLF, -0.40%), while discouraging buying in the utilities sector (XLU, -1.27%). While the XLF did finish on its low for the day and in negative territory, it still managed to finish the session as one of the best performing sectors and the new recent high in the TNX was a primary reason why. I look for continuing relative strength in financials, although we'll hear the latest from the Fed tomorrow at 2pm.
Healthcare (XLV, -0.27%) was the best performing sector on Monday as biotechs ($DJUSBT) managed to eke out a small gain to keep their recent winning streak alive. I expect that biotechs will be among 2018's biggest winners given their recent breakout of a bullish continuation pattern that began in 2015.
Pre-Market Action
Most Asian markets were down 1% or more and that weakness has carried over into Europe, though losses there range from 0.50% to 0.60%. Here in the U.S., the Dow Jones is having a rough morning with futures lower by nearly 200 points with just under an hour to go to the opening bell. Losses on the S&P 500 and NASDAQ futures are slightly lower on a percentage basis.
The Fed begins its two day meeting today, with its FOMC policy statement due out at 2pm on Wednesday. The bond market has been bracing for a more hawkish tone from the Fed as the 10 year treasury yield ($TNX) is at its highest level in 3 1/2 years ahead of the announcement.
Pfizer (PFE) reported excellent earnings this morning and will be one to watch as pharmas ($DJUSPR) have recently broken out after a lengthy consolidation period.
Current Outlook
Apple, Inc. (AAPL) is certainly big enough where its earnings matter and we'll get the latest report from AAPL on Thursday after the closing bell. But traders are digging in their heels right now as a major price support battle looms. Check out gap and price support below:
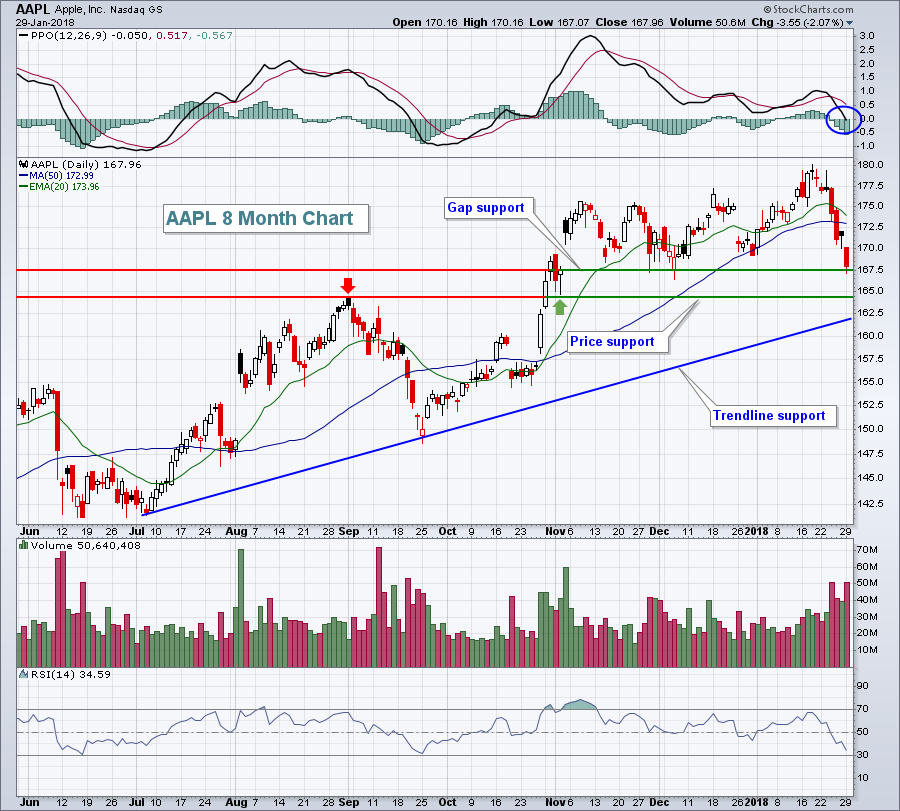 The daily RSI has dipped below 40 and I generally look for RSI 40 support to hold. However, we did see AAPL's RSI fall to 30 in both June and September of 2017 before bouncing to new highs. Will it happen again? Maybe. There are multiple reasons to look for a reversal soon. We have gap support at 167.50 being tested now. If that fails, there's price support just beneath 165. Finally, trendline support awaits closer to the 162.50 area. Given that AAPL recently traded at 180, entering during a potential 10% pullback to trendline support represents a very solid reward to risk ratio. And in an earnings season already full of big revenue and earnings beats, what are the chances that AAPL will disappoint?
Even if iPhone sales miss targets as many analysts have discussed, will AAPL lower or raise their targets in the year ahead with so many signs of a strengthening econony? We're a couple days away from finding out.
Sector/Industry Watch
The Dow Jones U.S. Brewers Index ($DJUSDB) is an industry group that I'm watching closely. It's provided us signals that its 15 month downtrend has ended, but if that's the case, then it's time to demonstrate its bullish conclusions to short-term selling. Currently, the DJUSDB is trading above both its 20 day EMA and its 20 week EMA. We have not seen that for three consecutive weeks since this downtrend began. But selling on the DJUSDB since it reached its 2018 intraday high at 914.39 now leaves with the group with significant tests on its daily and weekly charts. Here's a look at the weekly chart:
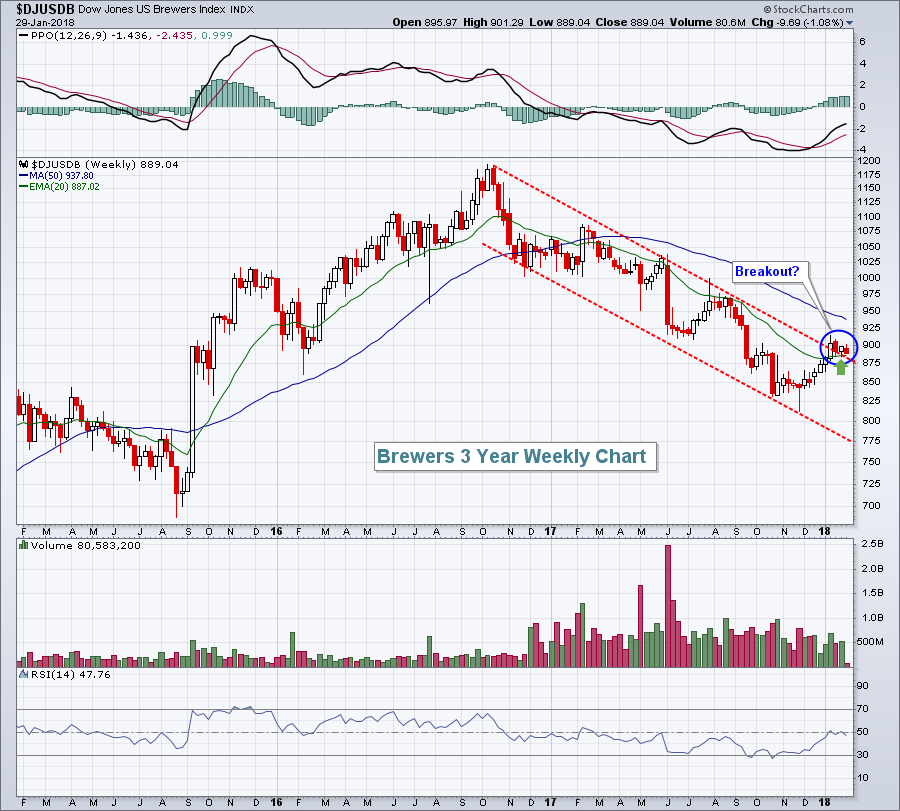 If we've truly witnessed a change in direction for the DJUSDB and the industry is now beginning a new uptrend, the rising 20 week EMA (green arrow) should provide support. After a move to 914, the DJUSDB has dropped back to 889, just 2 points above 20 week EMA support. Let's see if this key test for the bulls is a success.
Historical Tendencies
We're at the time of the calendar month where we typically see strength in U.S. equities. Let me stress that this is a tendency based on history, not a guarantee. Here is how the S&P 500 and NASDAQ have performed over the next four calendar days:
S&P 500 (since 1950):
30th: +12.87%
31st: +29.99%
1st: +46.80%
2nd: +38.09%
NASDAQ (since 1971):
30th: +10.61%
31st: +48.75%
1st: +60.75%
2nd: +34.40%
Let me clarify that these are annualized returns for each of the above calendar days for all months (ie, January 30th, March 30th, April 30th, May 30th, etc).
Key Earnings Reports
(actual vs. estimate):
AET: 1.25 vs 1.18
CNHI: .14 vs .14
DHR: 1.19 vs 1.16
DOV: 1.13 vs 1.04
GLW: .49 vs .47
HRS: 1.67 vs 1.40
MCD: 1.71 vs 1.59
PCAR: 1.18 vs 1.12
PFE: .62 vs .56
SAP: 2.08 vs 1.78
TROW: 1.52 vs 1.45
ZBH: 2.10 vs 2.10
(reports after close, estimate provided):
ALGN: .96
AMD: .05
BXP: 1.53
CA: .60
CB: 2.31
CHRW: .85
EA: 2.19
EQR: .81
ILMN: 1.22
JNPR: .52
SYK: 1.95
Key Economic Reports
November Case Shiller HPI to be released at 9:00am EST: +0.6% (estimate)
January consumer confidence to be released at 10:00am EST: 123.4 (estimate)
Happy trading!
Tom


