Market Recap for Tuesday, January 16, 2018
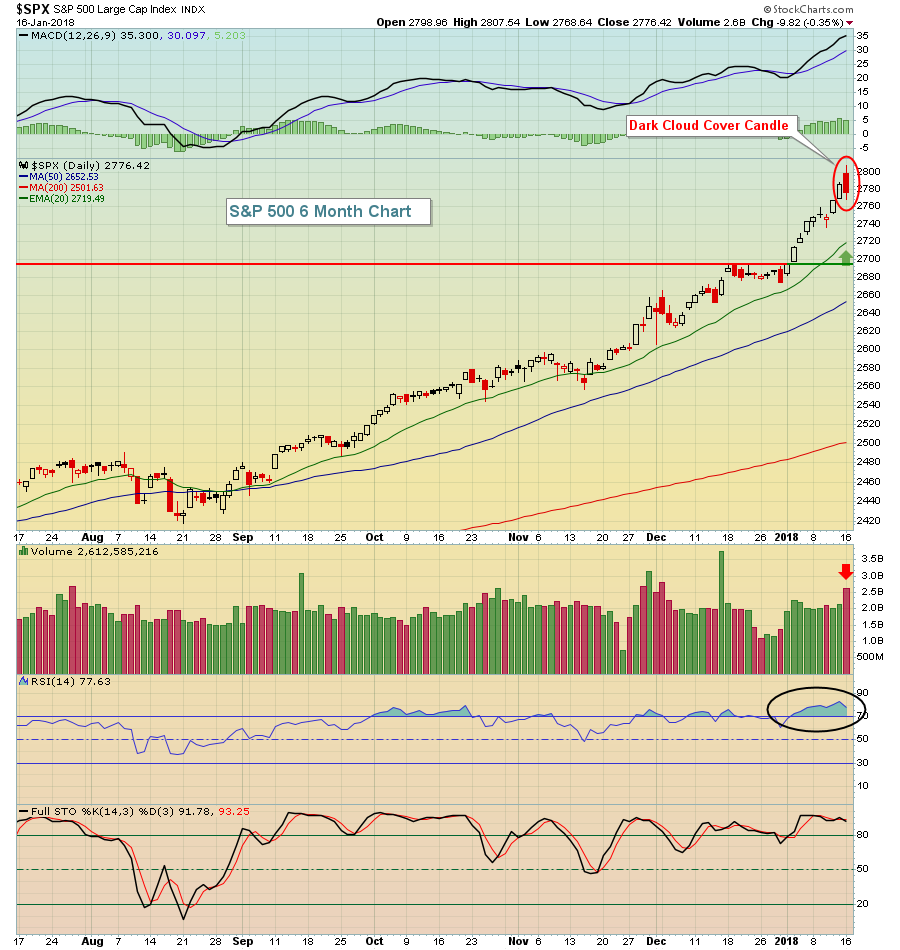
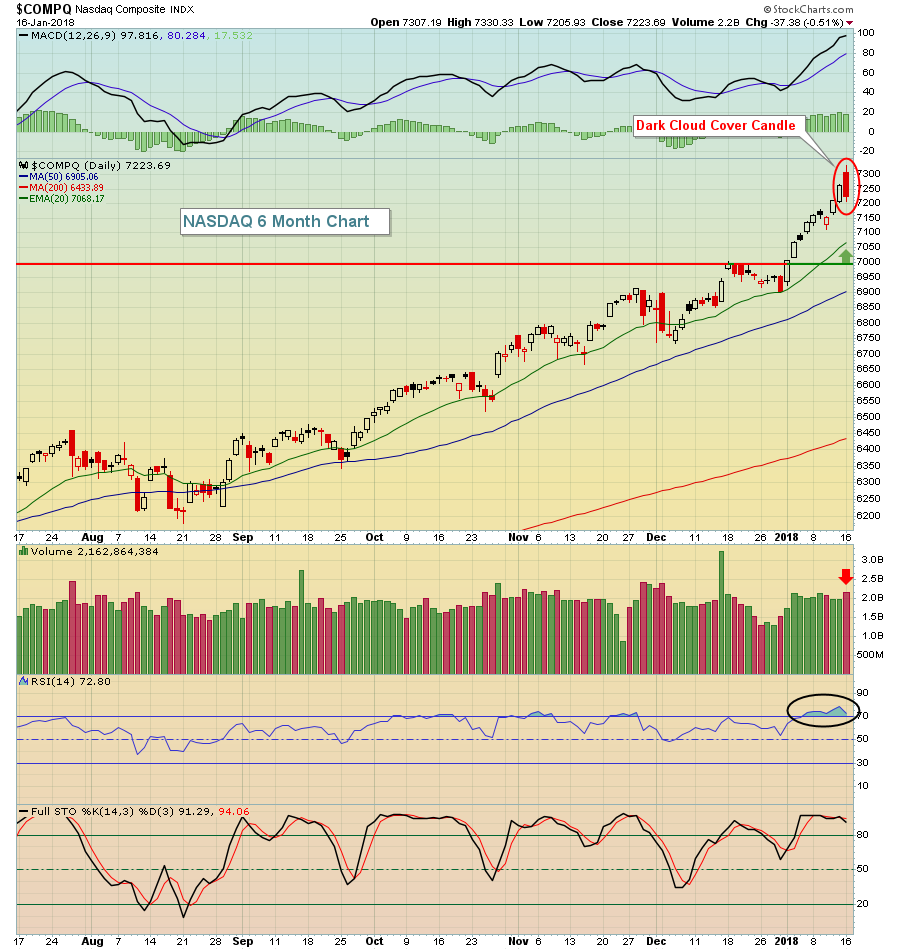
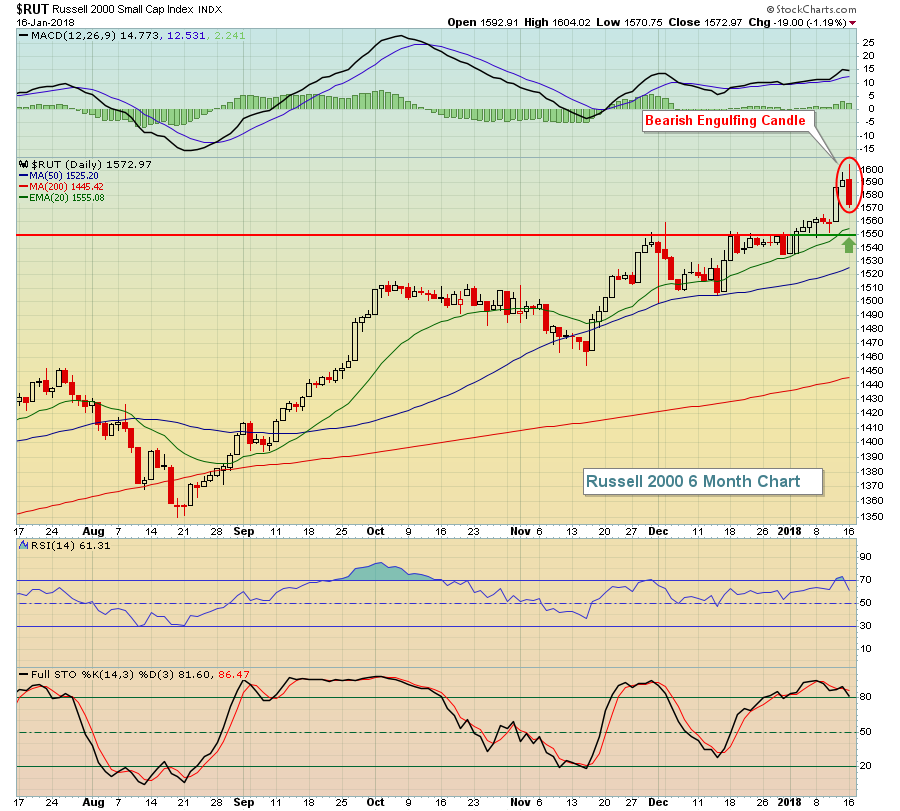
Tuesday was perhaps the most bearish day we've seen in quite awhile. For starters, volume on our major indices was the heaviest in the past 6-7 weeks, excluding option expiration Friday on December 15th. But the heavy volume, by itself, wasn't the problem. It was the fact that it accompanied a very significant reversal in price action. The S&P 500 and NASDAQ both printed reversing dark cloud cover candles and the Russell 2000 printed a bearish engulfing candle. Check out the charts:
S&P 500:
 NASDAQ:
 Russell 2000:
 Given that there were reversals on our major indices, it stands to reason that we'd see similar reversals across many different sectors and industry groups and that's exactly what we saw.
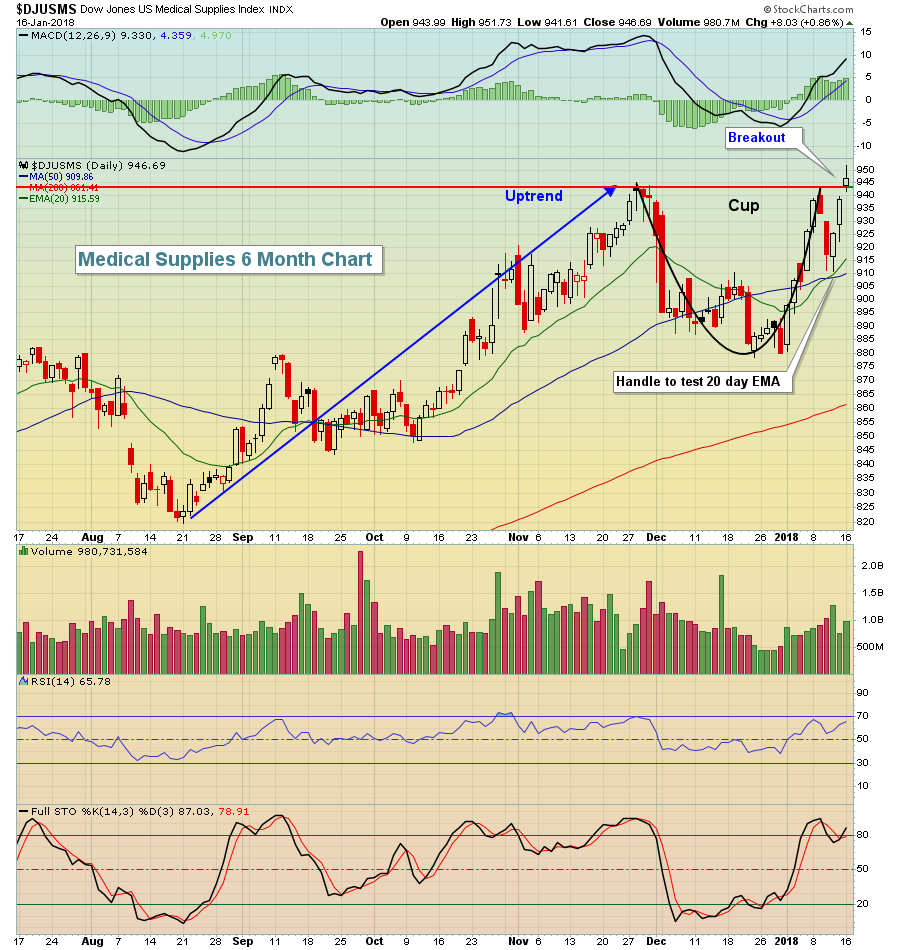
The four aggressive sectors - financials (XLF, -0.27%), technology (XLK, -0.39%), consumer discretionary (XLY, -0.71%) and industrials (XLI, -0.90%) - all reversed into negative territory after opening with very solid gains. There were pockets of strength, most notably in healthcare (XLV, +0.50%), where medical supplies ($DJUSMS) jumped nearly 1% to break out of a bullish cup with handle pattern:
 Utilities (XLU, -0.22%) were down again on Tuesday, but did manage to bounce after hitting support just beneath the 50.00 level. If the market struggles near-term, I'd look for the XLU to lead on a relative basis.
Pre-Market Action
Traders look to shake off the reversal on Tuesday as Dow Jones futures are up 113 points with 30 minutes left to the opening bell. Global markets did not get rattled overnight in Asia or this morning in Europe with mixed results there. This morning a new set of solid earnings reports have hit Wall Street and the bulls are back.
Current Outlook
Let's be clear about a couple of technical indications. On weekly charts, the major indices are all in unison and all show accelerating price momentum, which is bullish. Rising 20 week EMAs tend to provide excellent support. One issue, however, is that current prices reside well above those 20 week EMAs so a "healthy" pullback could result in a 5-6% decline, although I'm not predicting that. Just understand that a decline of that magnitude would have little technical significance on the longer-term weekly charts. Here's the NASDAQ chart as an example:
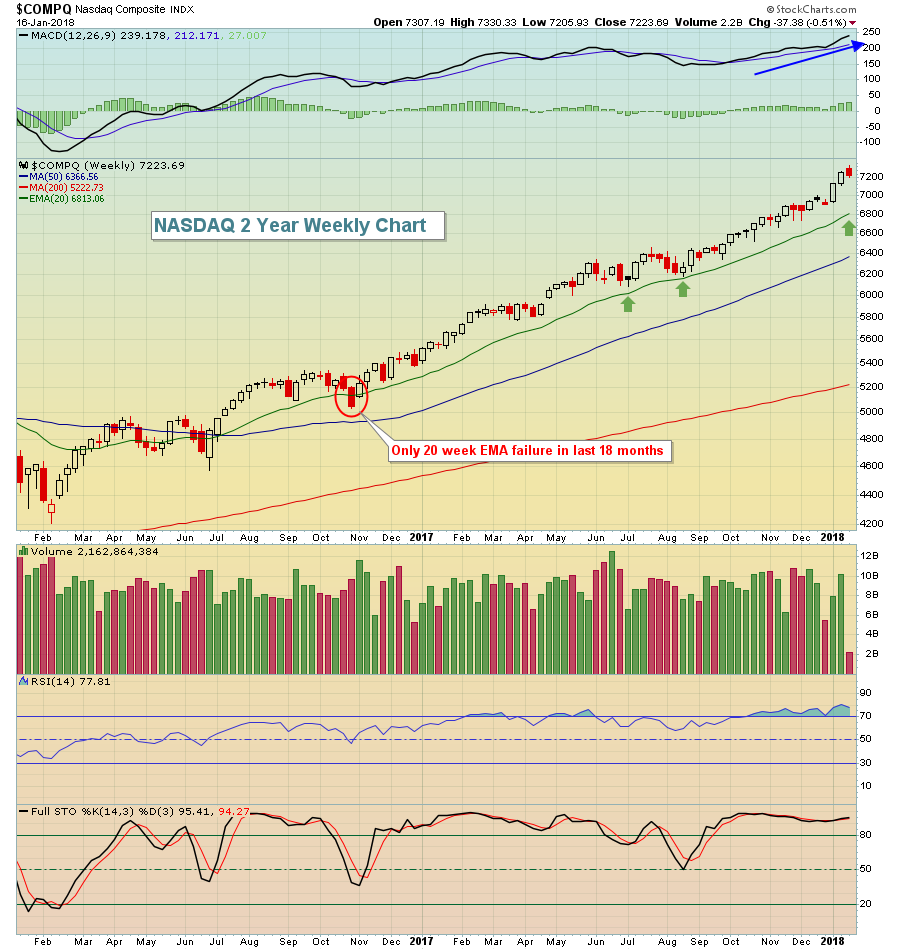 The red circle shows one instance where the rising 20 week EMA temporarily failed. Other than that, periods of consolidation and short-term selling have held that rising moving average (green arrows). A drop over the next few weeks to test that rising 20 week EMA isn't out of the question and, quite honestly, it'd help relieve very overbought weekly momentum oscillator readings.
The last time the NASDAQ gapped up, then failed to sustain the strength, was in mid-December. After that, we watched the NASDAQ meander sideways for two weeks. Also, keep in mind that we're approaching the 19th through 25th period of the month. Since 1971, the NASDAQ has produced annualized returns of -5.37% from the 19th through the 25th of ALL calendar months.
The first thing I'll be watching for is to see whether Tuesday's intraday high or low is cleared first. If yesterday's opening high holds as resistance and we break below the intraday lows, I'd be looking for more consolidation, possibly selling over the next few days - at a minimum.
Sector/Industry Watch
Expect more selling in retail stocks (XRT). A negative divergence haunts the group currently and yesterday's bearish engulfing candle adds to the short-term bearishness. I'm still bullish the group, especially considering the February through April seasonal pattern discussed below in Historical Tendencies. But the next couple weeks could be dicey.
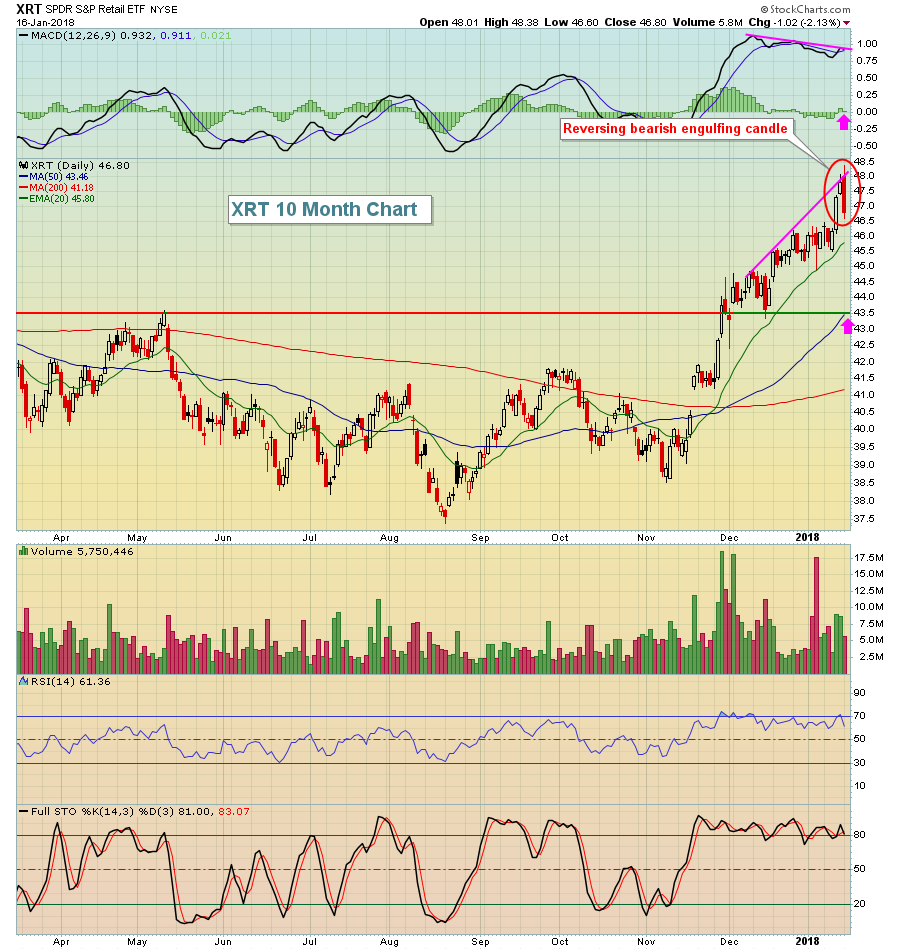 I never look to technical analysis for guarantees. I use it to manage risk. The negative divergence above does not guarantee us of lower prices ahead. Instead, it simply warns us of the increasing risk of a decline. In such situations, I'd rather be safe and take profits ahead of a possible decline. As a short-term trader, that's what I'd be considering here.
Historical Tendencies
As mentioned above, retail stocks love February through April. Over the past 13 years, the XRT has produced average monthly returns as follows for each of the upcoming calendar months:
February: +3.0%
March: +4.4%
April: +2.8%
Key Earnings Reports
(actual vs. estimate):
ASML: 1.77 vs 1.25
BAC: .47 vs .44
FAST: .45 vs .45
GS: 5.68 vs 4.90
SCHW: .44 vs .41
USB: .88 vs .87
(reports after close, estimate provided):
AA: 1.23
KMI: .18
Key Economic Reports
December industrial production to be released at 9:15am EST: +0.4% (estimate)
December capacity utilization to be released at 9:15am EST: 77.3% (estimate)
January housing market index to be released at 10:00am EST: 73 (estimate)
Beige book to be released at 2:00pm EST
Happy trading!
Tom


