Market Recap for Monday, February 5, 2018
What a day and especially what a final hour! It was very reminiscent of selling episodes in 2008 where our major indices were losing a percent every few minutes. From a bullish perspective, there's little defense from panicked selling other than to be in cash and wait out the mayhem. Selling was everywhere. The Dow Jones was down more than 1500 points during the final hour yesterday, but incredibly volatile action saw hundreds and hundreds of points gained and then lost in that final 60 minutes. It was a roller coaster ride that any amusement park would have been proud of.
By day's end, the Dow Jones, S&P 500, NASDAQ and Russell 2000 shed 4.60%, 4.10%, 3.78% and 3.63%, respectively. The dollar ($USD) and gold ($GOLD) both managed gains, but there was little else on the positive side of the ledger. All nine sectors fell including financials (XLF, -5.04%), the hardest hit, and industrials (XLI, -4.54%). With the 10 year treasury yield ($TNX) finally dropping from a rush into defensive bonds, utilities (XLU, -1.64%) ended up the best performing sector - if you want to call it that.
From an industry group perspective, marine transportation ($DJUSMT) gained 2.71% as the only industry group to rise during yesterday's session. It was a whitewash and, quite honestly, looking at sector and industry charts right now yields us little in the way of clues as panicked markets don't act rationally. So instead, much of today's blog will focus on sentiment, specifically the Volatility Index ($VIX).
Pre-Market Action
Global markets sold off hard in response to the panicked selling on Wall Street on Monday. Tokyo's Nikkei ($NIKK) fell more than 1000 points, or 4.73%, while Hong Kong's Hang Seng Index ($HSI) tumbled more than 1600 points, or 5.12%. That selling carried over to Europe this morning where the German DAX ($DAX) is down 2.44%. Other key European markets are down in the 2-3% range.
In the U.S., Dow Jones futures are very red once again, currently down 269 points in a pre-market session featuring wild swings in both directions. Look for much more volatility in today's session. Lows established during Monday's panicked session will become very important. Loss of that very near-term support could lead to additional panic and rapidly declining prices.
Current Outlook
Selling episodes like the one we're mired in right now are not logical. Fear ramps up, as does volume, and there's little that's rational about it. So trying to point out a strong support level for a rally is an exercise in futility. Catching the exact bottom is nearly impossible because you have to be willing to jump in during a period of panic and we should all know by now how rapidly the stock market sells during panicked phases.
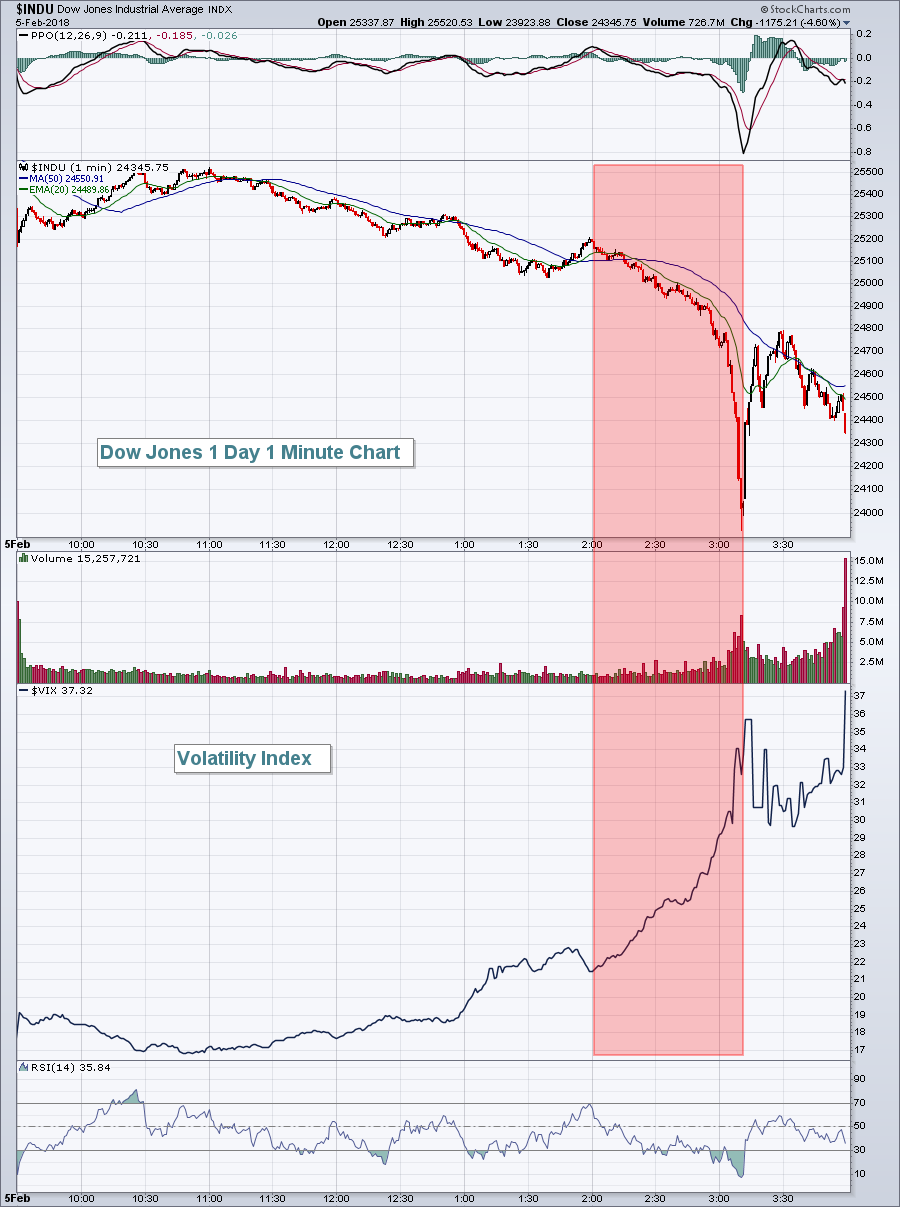
On Monday, the Dow Jones was down more than 1500 points before buyers stepped in just after 3pm to spare U.S. stocks more technical damage. The ensuing rally totaled nearly 900 points and lasted roughly 20 minutes before selling picked back up and carried us into the close on a negative note. Here's a look at the Dow's one day chart, highlighting the late day plunge:
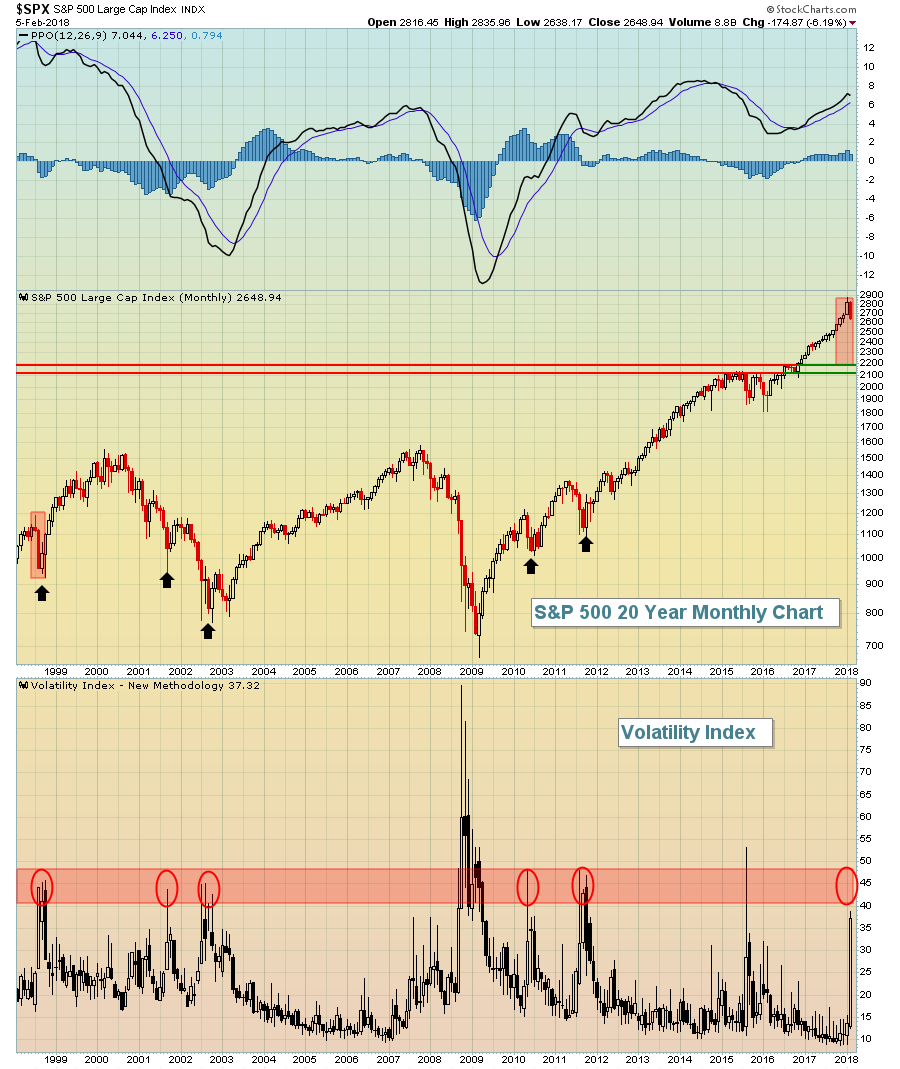
 At 2pm, the Dow Jones was down a bit more than 300 points - a bad day, but certainly not representative of panicked selling. That changed over the next 70 minutes (red shaded area above) as the Dow Jones tumbled another 1200 points on very heavy volume. Buyers disappeared, including the market makers that provide liquidity, as fear ramped up to levels not seen since the summer of 2015. The good news? Historically, VIX readings in the 40s have marked major market bottoms. See below.
Sector/Industry Watch
For this section, let's stick with the VIX as it tends to be an excellent indicator in terms of spotting market bottoms. Panicked selloffs do not follow traditional technical analysis rules. They rarely respond to price support levels, trendlines, moving averages, etc. Supply swamps demand at those levels and the bulls have no defense. It's not until the panicked selling reaches epidemic proportions that we find a bottom. Here's a long-term chart of the VIX and the S&P 500. Check it out and you can come to your own conclusions:
 There's a lot of history where VIX readings in the 40s have marked significant bottoms. As I look back to these periods, the one that stands out to me as similar to today is the selloff in the summer of 1998. If you recall, the stock market was in an extended bull market at that time and there was a very quick panicked selloff before the stock market rose again to a final high in 2000. The other high VIX readings occurred during a period where the market was downtrending in a bear market OR was in the early stages of a bull market where market participants were skeptical. The vertical, rectangular shaded area represents the percentage drop during that period and I've overlayed that in the current period. If this weakness plays out similar to the one in 1998, look for a test of price support near 2200. That would represent loss of all the gains-to-date from early November 2016. For me, this is a worst case scenario. I'll be looking for other reversal signs along the way. But the message the above chart tells me is this - ALWAYS be careful when the VIX is surging higher as market losses can be very, very steep.
Historical Tendencies
The start to February has been very difficult, but the NASDAQ's month-to-date loss of 5.99% is nowhere near its worst February on record. That belongs to 2001, when the NASDAQ fell an unprecedented 22.39%. Let's hope we don't threaten that record.
Key Earnings Reports
(actual vs. estimate):
ABC: 1.55 vs 1.35
ADM: .82 vs .70
AGN: 4.86 vs 4.75
BDX: 2.48 vs 2.40
BP: .11 vs .10
CMI: 3.03 vs 2.65
CNC: .97 vs .94
EMR: .58 vs .54
FIS: 1.36 vs 1.34
GM: 1.65 vs 1.34
LH: 2.45 vs 2.37
SPGI: 1.85 vs 1.63
(reports after close, estimate provided):
AKAM: .63
APC: .03
CERN: .61
DIS: 1.62
GILD: 1.70
MCHP: 1.35
PXD: .76
SNAP: (.15)
Key Economic Reports
None
Happy trading!
Tom


