Market Recap for Monday, March 5, 2018
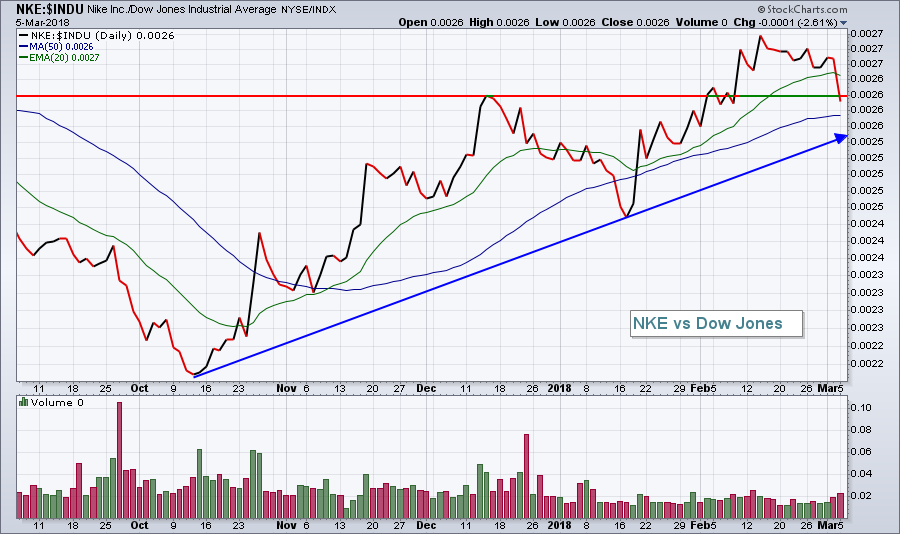
The Dow Jones surged on Monday, gaining 337 points (+1.37%) to lead all of our major indices higher. Two stalwarts - Caterpillar (CAT, +3.24%) and Boeing (BA, +2.34%) - were the leaders, but we saw 29 of the 30 Dow components gain yesterday. The one bad apple? No, it wasn't Apple (AAPL, +0.35%), although this tech giant did finish 28th out of 30 within the Dow. The shoe just didn't fit for Nike (NKE, -1.27%), which had the distinction of being the "sole" Dow stock to finish in negative territory on an otherwise very bullish day. The ironic part is that NKE has been one of the best performing Dow stocks since October 2017. Check out this relative chart:
 NKE's relative strength has cooled off the past few weeks, but the 5 month relative uptrend remains intact. There's a very good chance that NKE's relative weakness lately is providing an opportunity for entry.
In an odd twist, all nine sectors advanced yesterday. That, by itself, isn't so odd. But the leading sector certainly was. Utilities (XLU, +2.04%) led all other sectors and that usually doesn't occur (1) when the market is very bullish and (2) when the 10 year treasury yield ($TNX) finishes higher. Bull market rallies tend to see money rotate towards aggressive sectors - which it did to some degree on Monday. Rising treasury yields tend to favor financials (XLF, +1.41%) and industrials (XLI, +1.20%), not utilities. It's a development worth watching, but the XLU still has walls of resistance to climb so, for now, I'd view this relative strength as a one day wonder.
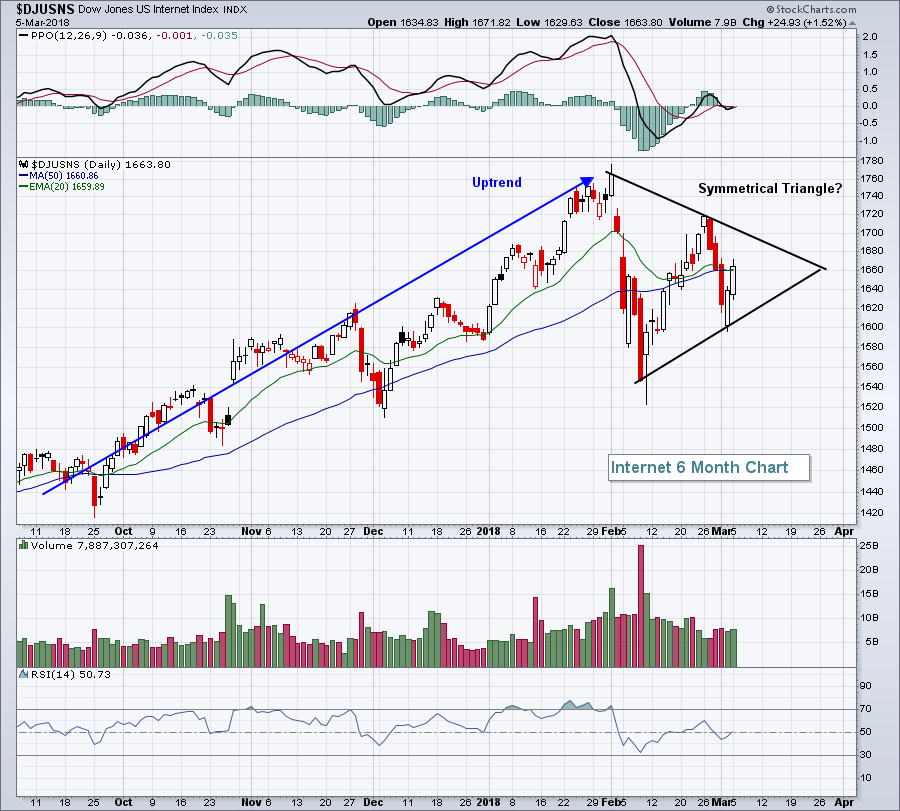
Internet stocks ($DJUSNS) performed very well within the technology (XLK, +1.02%) and could be squeezing into a bullish symmetrical triangle pattern. This is one of the patterns I mentioned a few weeks back that could develop as the overall market consolidates. Check out the visual:
 A symmetrical triangle pattern is one of many continuation-type patterns. This chart could develop in a variety of ways. The things that are clear are (1) we've been in a bull market, (2) there's an uptrend that preceded the current consolidation and (3) the bulls and bears are now battling unlike any battle we've seen since late-2016. A new low could emerge, in which case I might look for a bullish wedge to develop. I'll remain on the lookout for bullish continuation patterns as I believe we remain in a bull market with fresh new highs around the corner.
Pre-Market Action
We are seeing global strength as Asian markets closed much higher overnight with the Hang Seng Index ($HSI) climbing more than 2%, while Tokyo's Nikkei ($NIKK) jumped 1.79%. In Europe, we're seeing solid gains as well with the German DAX ($DAX) rising 114 points, or 0.94%, at last check, bouncing once again from key price support near 11900. The DAX printed a huge bullish engulfing candle yesterday so today's strength is confirming the reversal.
In the U.S. this morning, Dow futures are higher by 129 points as our major indices look to extend Monday's gains.
Current Outlook
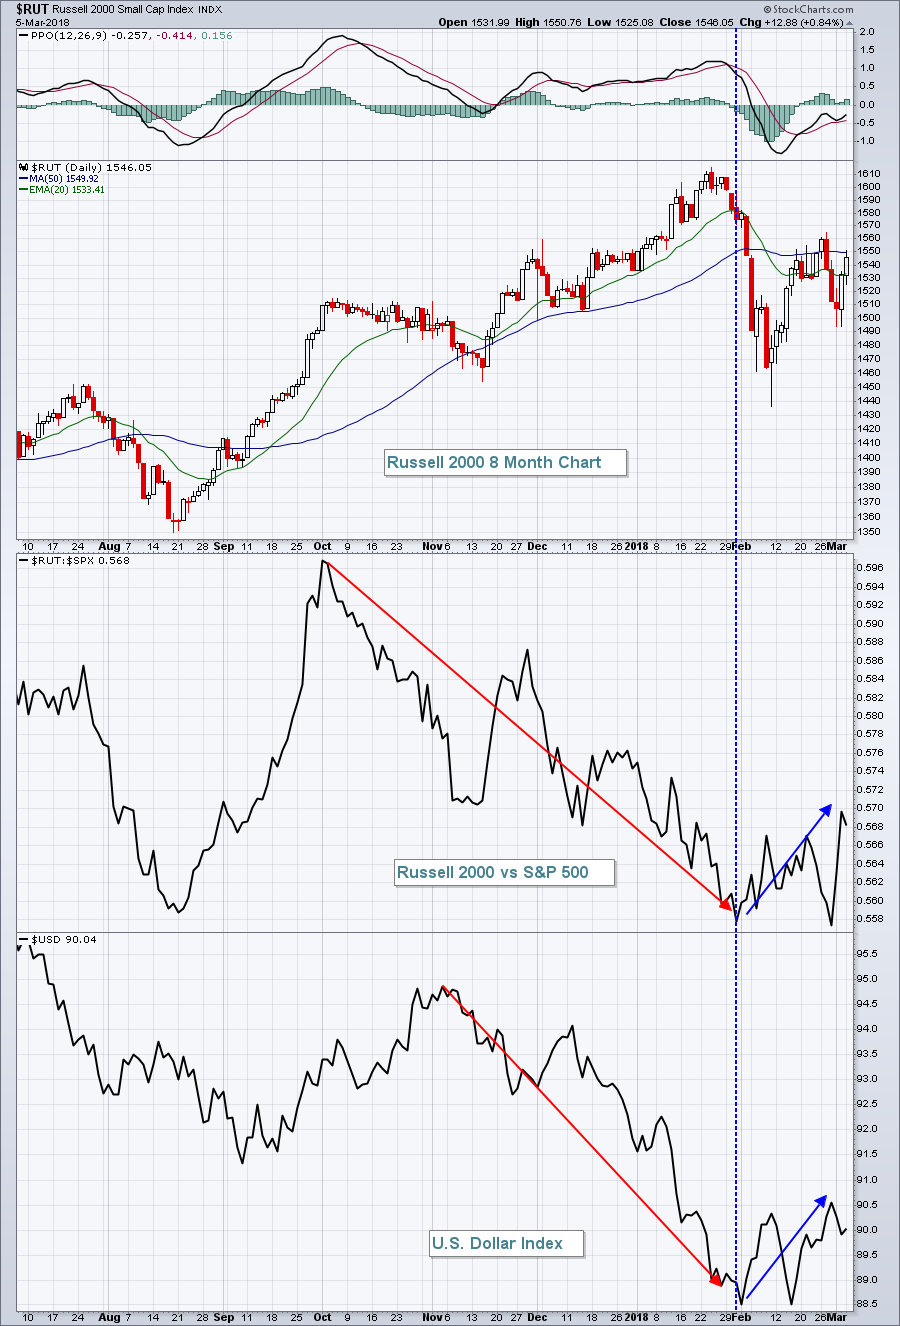
It's time to consider small caps for a variety of reasons. First, they have seasonal tailwinds at their back. As I noted below in the Historical Tendencies section, the Russell 2000 ($RUT) performs very well in March. Its March performance trails only December throughout the calendar year. Over the past 20 years, the Russell 2000 has outperformed the S&P 500 13 times during March, or 65% of the time. But there's more to this story than just seasonality.
The rapidly declining dollar was a boon to multinational companies found on the S&P 500, while acting more as a head wind for small caps. That seems to be changing with the improving U.S. Dollar Index ($USD). Take a look at this chart:
 We could have seen a changing of the guard in February, though, as a double bottom printed on the U.S. dollar and both the dollar and the RUT:SPX moved to 5 week highs recently. A rising dollar will have a negative impact on the net earnings of large multinational companies and would likely force the rotation of money from the SPX to the RUT. We could be seeing the beginning of such rotation now. Keep an eye on the dollar as that will be a key factor in the RUT's relative strength.
Sector/Industry Watch
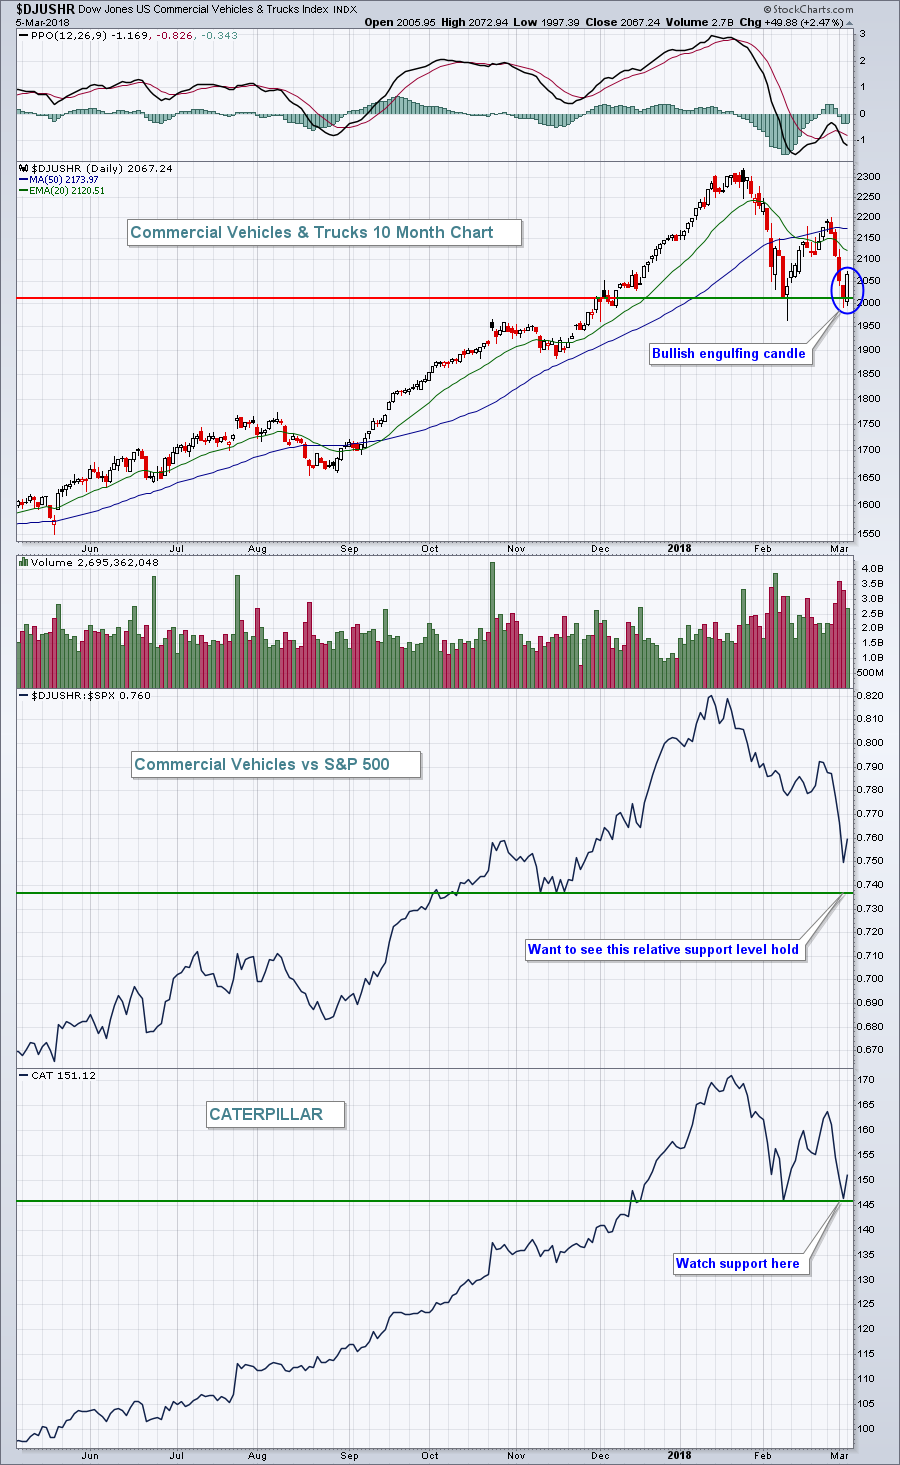
It was reversal day for Commercial Vehicles & Trucks ($DJUSHR). This is big news for a couple of reasons. First, key short-term price support held and the bullish engulfing candle is confirmation that we should be looking for higher prices ahead. Second, the DJUSHR has been a relative leader in the past and the reversing candle could be a precursor to future relative strength. Here's the chart:
 Yes, the relative strength in the DJUSHR has been very weak in 2018 thus far. However, let's first realize that the relative strength was off the charts in 2017 and we need to give the DJUSHR time to consolidate. In other words, unless the DJUSHR loses the recent price support near 2000 and/or the relative price support near 0.7375, I'm still bullish this group. CAT has been a "pillar" of strength for the DJUSHR and so this would be one stock to consider should the DJUSHR resume its prior relative strength.
Historical Tendencies
Historically, March has been very kind to the small cap Russell 2000 and we're beginning to see some relative strength in this area. So let's dig a little deeper to see how the RUT performs throughout March. Here are the annualized returns by period since 1987:
March 1-6: +38.89%
March 7-10: -4.73%
March 11-18: +45.61%
March 19-28: -9.03%
March 29-31: +44.98%
March's 17.21% annualized return ranks as the 2nd best calendar month for small caps, trailing only December's amazing 34.08% annualized return.
Key Earnings Reports
(actual vs. estimate):
TGT: 1.37 vs 1.39
(reports after close, estimate provided):
ADSK: (.12)
ROST: .93
Key Economic Reports
January factory orders to be released at 10:00am EST: -1.2% (estimate)
Happy trading!
Tom


