Market Recap for Wednesday, March 28, 2018
The U.S. stock market settled down on Wednesday and that could be very good news for the bulls. High volatility ($VIX) has stunned equity traders the past two months after a 15 month period of little volatility. But on Wednesday, the VIX fell more than 8% from its intraday high as the Dow Jones traded in a fairly narrow 300 point range throughout much of the day. I say "fairly narrow" range from a relative perspective as the Dow Jones has had much larger 500-750 point intraday ranges in recent sessions.
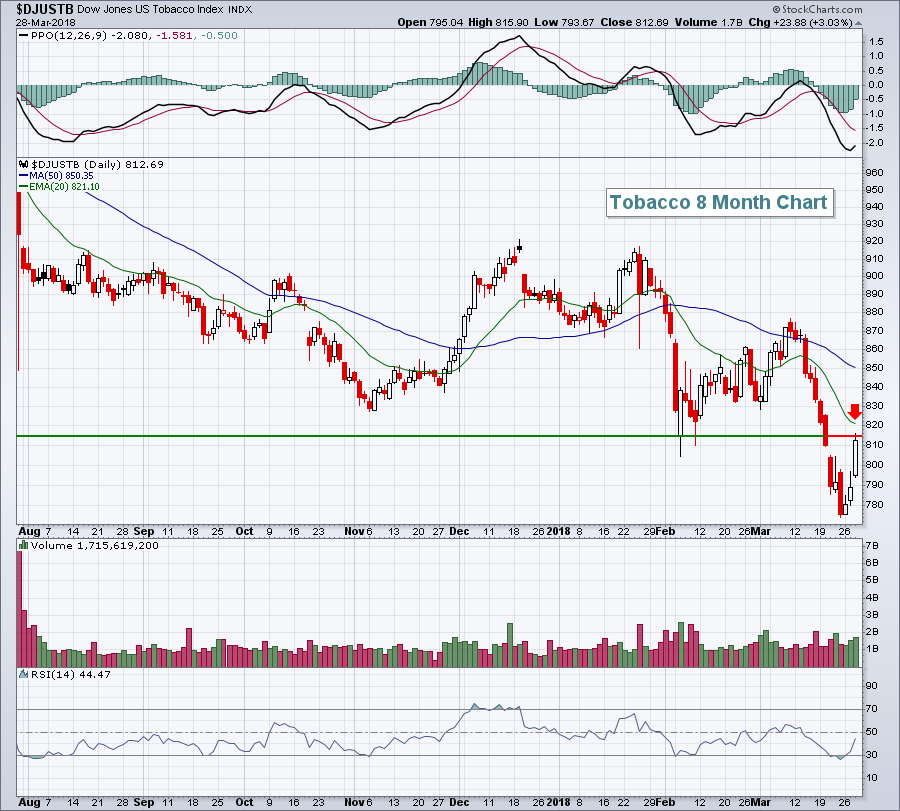
Consumer staples (XLP, +1.38%) was the undisputed sector leader on Wednesday as this defensive area benefited from a surging and very oversold tobacco group ($DJUSTB). There's plenty of overhead resistance approaching for tobacco stocks so be careful not to get "smoked" chasing after the recent strength:
 The RSI had moved beneath the oversold 30 level, similar to early August. But that oversold period resulted only in a bounce to test the rising 20 day EMA a few days later. We could see the same thing now. A close back above 820 could be the start of something more significant, but I'd have to see it first.
Pre-Market Action
Crude oil ($WTIC) has backed off of significant price resistance at $66 per barrel in recent days, and this morning resides a bit above $64 per barrel. Gold ($GOLD) has fallen similarly in recent sessions and is down fractionally again today at $1327.
We've seen a reprieve in global equity markets as both Asia and Europe have rallied overnight and this morning, respectively. Dow Jones futures are higher by 82 points with a little more than 30 minutes left to the opening bell.
Current Outlook
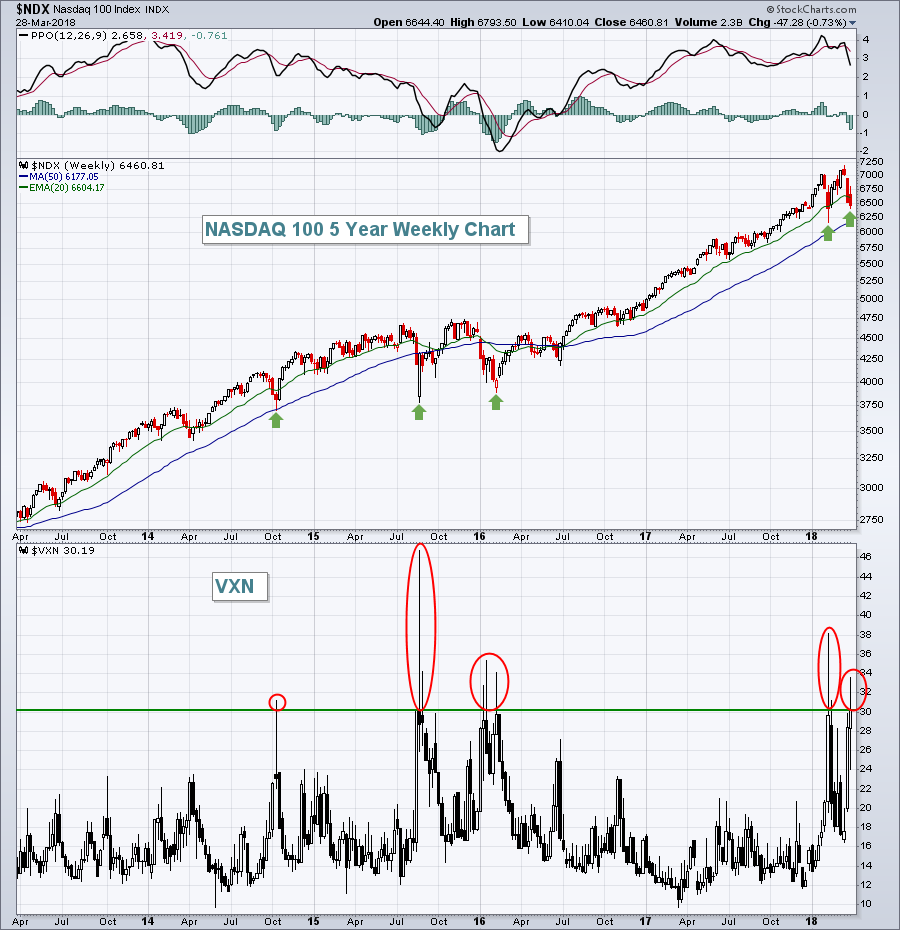
Is a double bottom in on the benchmark S&P 500? Will we rally from here? I believe we will. I jumped back in late yesterday afternoon as the NASDAQ 100 Volatility Index ($VXN) appeared to have topped at a very important level. First, let's look at the long-term weekly chart of the VXN and how readings in the 30s have typically coincided with major NASDAQ 100 bottoms:
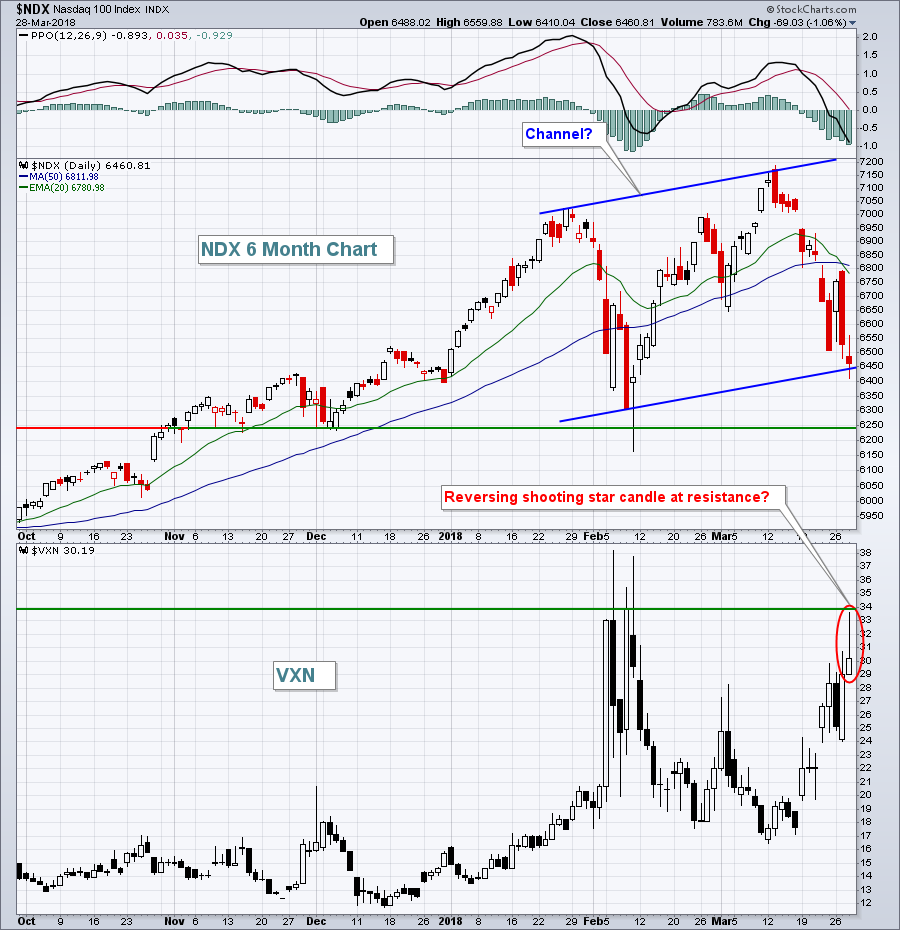
 This is a longer-term view and shows how an elevated VXN has historically been bullish for NASDAQ 100 stocks. Now here's the shorter-term daily view:
If that candle ends up marking the high on the VXN, then we've likely just seen the NASDAQ 100 bottom.
Sector/Industry Watch
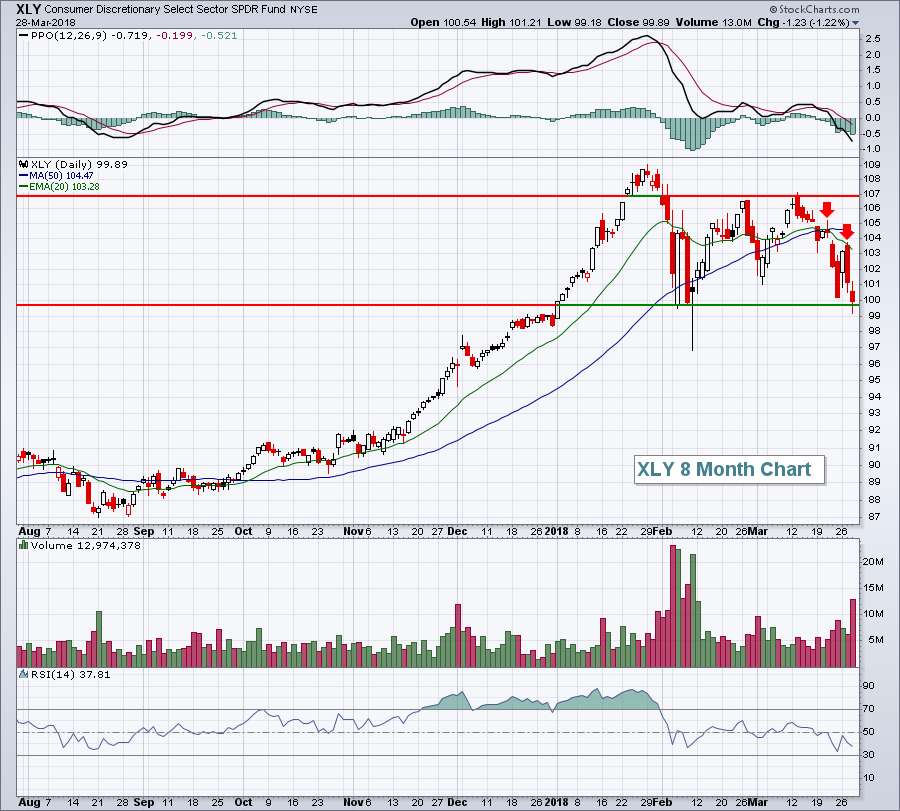
The consumer discretionary ETF (XLY) has hit key price support and has been failing at its 20 day EMA on rallies, so the trading range is set:
 We've seen a "death cross", where the shorter-term 20 day EMA falls below the longer-term 50 day SMA, so the short-term price action is clearly negative. However, the February low has held thus far and the XLY has an opportunity to rally from here. The two red arrows mark previous attempts to clear the declining 20 day EMA. Both attempts failed. Should the XLY navigate the 20 day EMA resistance successfully, price resistance closer to 107 awaits.
Historical Tendencies
The stock market tends to have a pre-earnings run up as market participants bid up shares in anticipation for solid earnings results. For instance, the S&P 500 (since 1950) has produced annualized returns of +28.12% for the period April 1st through 18th. That's more than triple the normal 9% that the S&P 500 typically enjoys throughout the year.
Key Earnings Reports
(actual vs. estimate):
STZ: 1.90 vs 1.74
Key Economic Reports
Initial jobless claims released at 8:30am EST: 215,000 (actual) vs. 228,000 (estimate)
February personal income released at 8:30am EST: +0.4% (actual) vs. +0.4% (estimate)
February personal spending released at 8:30am EST: +0.2% (actual) vs. +0.2% (estimate)
March Chicago PMI to be released at 9:45am EST: 62.8 (estimate)
March consumer sentiment to be released at 10:00am EST: 102.0 (estimate)
Happy trading!
Tom


