Market Recap for April 23, 2018
A significant bullish breakout in the U.S. Dollar ($USD) occurred on Monday and the push higher is likely to just be beginning. Before I look at possible ramifications, let's look at the chart itself:
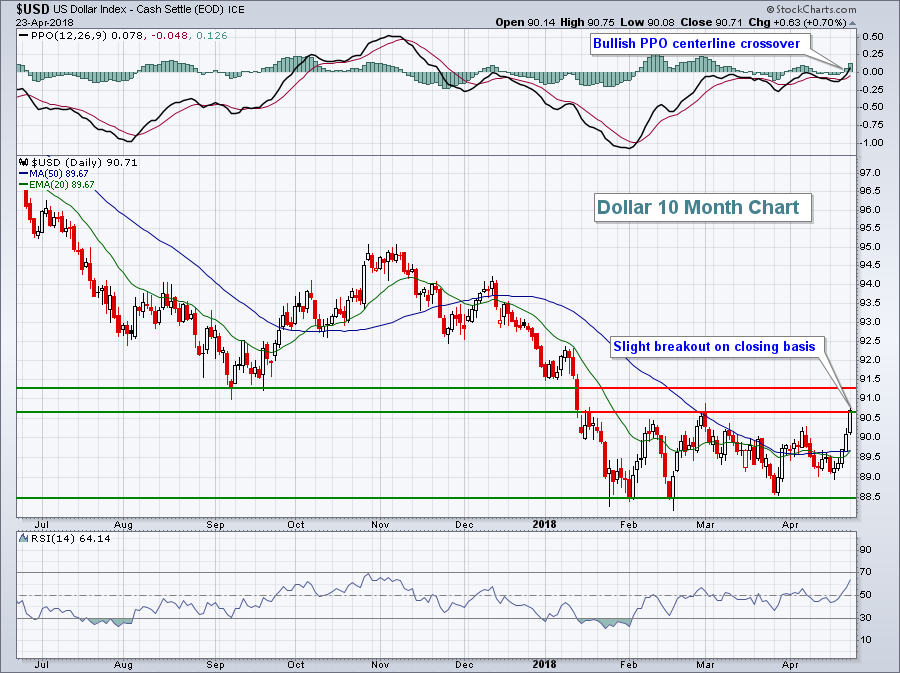 Monday's close was the USD's highest since mid-January. A breakout could hurt performance of the S&P 500 over the next few months as a higher dollar would result in currency translation losses for multinational companies. It could be a boon for smaller cap, Russell 2000 ($RUT) companies, however. More on that in the Current Outlook section below.
We had a late day rally on Monday, cutting into earlier losses. The S&P 500 actually ended the day with a fractional gain, best of our major indices despite the rising dollar. Sectors were mixed with energy (XLE, +0.61%) leading to the upside. Semiconductors ($DJUSSC, -1.47%) were very weak once again and that weighed on technology (XLK, -0.36%), the session's laggard.
Clothing & accessories ($DJUSCF, +1.82%) led consumer discretionary (XLY, +0.21%) and remain one of the strongest industry groups. The DJUSCF is on the verge of a breakout to fresh new highs, but could see short-term handle consolidation following the possible cup that's formed:
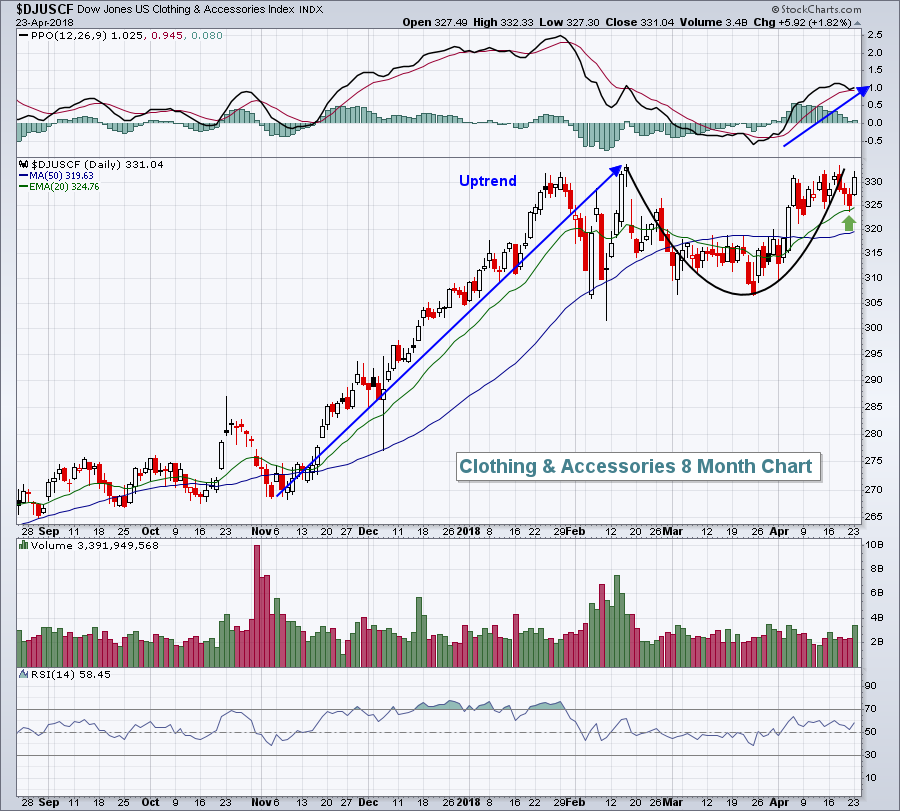 An argument can be made that the handle has already formed with the test of the rising 20 day EMA on Friday (green arrow). Either way, a move to new highs would be a technically bullish development.
Pre-Market Action
Futures are solid this morning after Asian markets rose overnight and earnings reports this morning were mostly better-than-expected. Caterpillar (CAT) is helping to lead the charge, rising 4.5% in pre-market trading, after delivering solid revenues and earnings.
Dow Jones futures are higher by 154 points with just under an hour left to the opening bell.
Current Outlook
The direction in U.S. treasury yields vs. foreign treasury yields is a primary driver of the U.S. Dollar Index ($USD) historically. I generally look at the U.S. treasury yields vs. German treasury yields ($UST10Y - $DET10Y) to help forecast the USD's direction. In recent months, U.S treasury yields have been rising much faster, but the dollar has struggled to follow suit. I've been discussing the growing likelihood that the dollar would break out and begin to play "catch up" with yields. Monday's action could be the start of such a move:
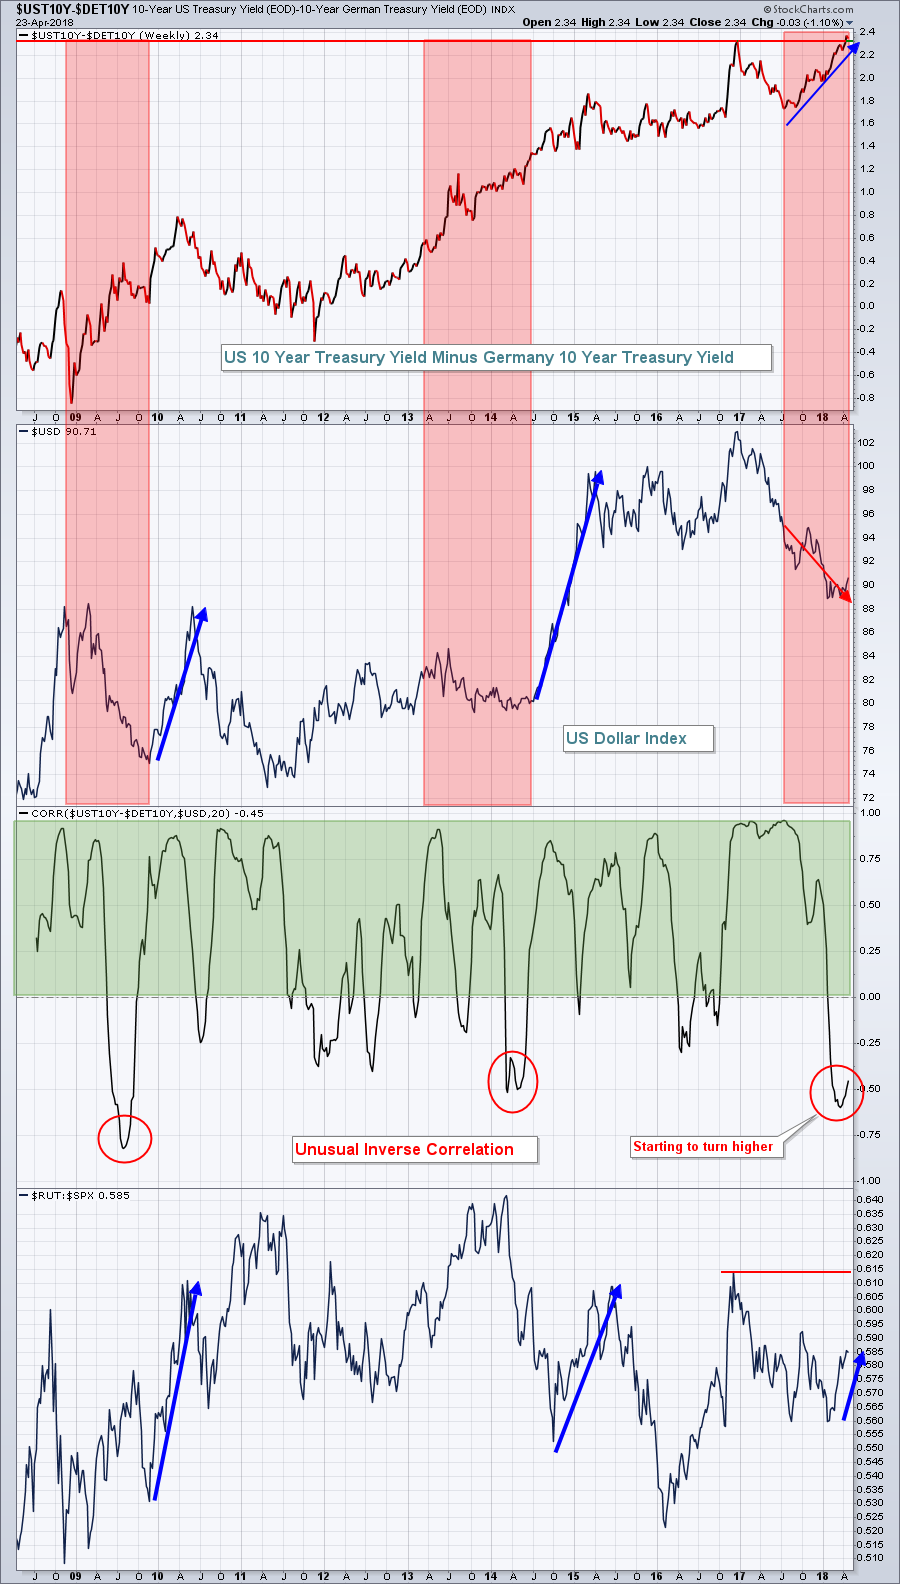 The direction of US treasury yields (vs. Germany) tends to positively correlate to the direction of the USD. In the past, when we've seen a rare negative correlation, the USD has quickly reversed back to the upside and that dollar strength has resulted in significant outperformance by small cap stocks, whose earnings are not impacted by a rising dollar.
Sector/Industry Watch
A lot has been written recently about energy (XLE), as it broke above 69.00 to end its 66-69 trading range. Well, yesterday it reached another milestone, breaking to a new relative high vs. the benchmark S&P 500:
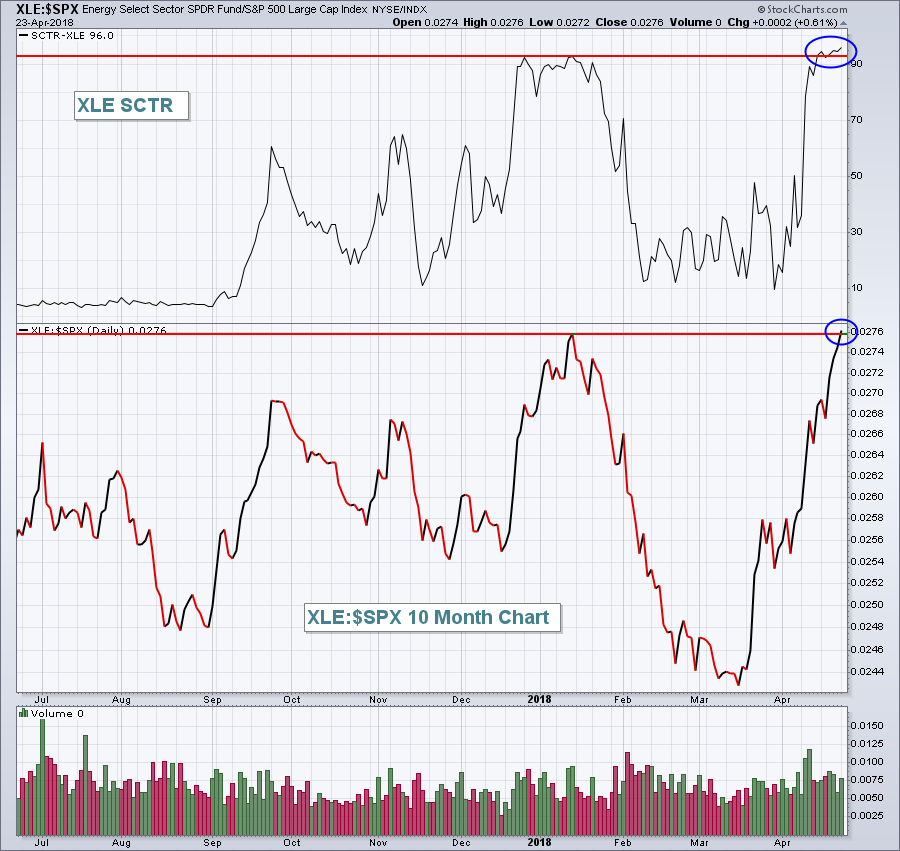 The relative strength in energy is apparent in two ways. First, Monday's strength resulted in the XLE's highest relative strength level (vs. the SPX) over the past 10 months. Also, check out the breakout to new SCTR highs as well. As a trader, it's much easier to outperform the benchmark S&P 500 if you're trading within a group that's outperforming.
Historical Tendencies
Yesterday, I highlighted the historical performance of the NASDAQ over the next two weeks. Today, let's look at those same two weeks on the S&P 500 (since 1950):
April 23rd through 27th: -3.11%
April 28th through May 5th: +25.94%
While this week tends to underperform a bit, the latter part of April into the first week of May usually outperforms.
Key Earnings Reports
(actual vs. estimate):
BIIB: 6.05 vs 5.93
CAT: 2.82 vs 2.11
GLW: .31 vs .30
KO: .47 vs .46
LLY: 1.34 vs 1.13
LMT: 4.02 vs 3.35
MMM: 2.50 vs 2.50
NEE: 1.94 vs 1.78
SAP: .90 vs .87
SHW: 3.57 vs 3.14
TRV: 2.46 vs 2.68
UTX: 1.77 vs 1.51
VZ: 1.17 vs 1.11
(reports after close, estimate provided):
AMGN: 3.23
AMX: .50
CB: 2.24
COF: 2.34
EW: 1.10
ILMN: 1.03
TXN: 1.11
Key Economic Reports
February Case Shiller HPI to be released at 9:00am EST: +0.7% (estimate)
February FHFA house price index to be released at 9:00am EST: +0.5% (estimate)
March new home sales to be released at 10:00am EST: 630,000 (estimate)
April consumer confidence to be released at 10:00am EST: 126.1 (estimate)
Happy trading!
Tom


