Market Recap for Friday, April 13, 2018
U.S. stocks fell on Friday the 13th, but managed to cut intraday losses in half (or more) during the final 45 minutes of the session. Most of our major indices lost roughly 0.50%, except for the benchmark S&P 500, which fell a more palatable 0.29%. Six of nine sectors lost ground, including a very weak financials sector (XLF, -1.51%) after several large banks reported mostly excellent quarterly earnings results. Banks ($DJUSBK, -2.44%) jumped higher at the open as key banking leaders like JP Morgan Chase (JPM, -2.71%) and Citigroup (C, -1.55%) beat Wall Street EPS estimates. I'm still a fan of banks as they should do well in a rising interest rate environment, but they now have massive overhead resistance as follows:
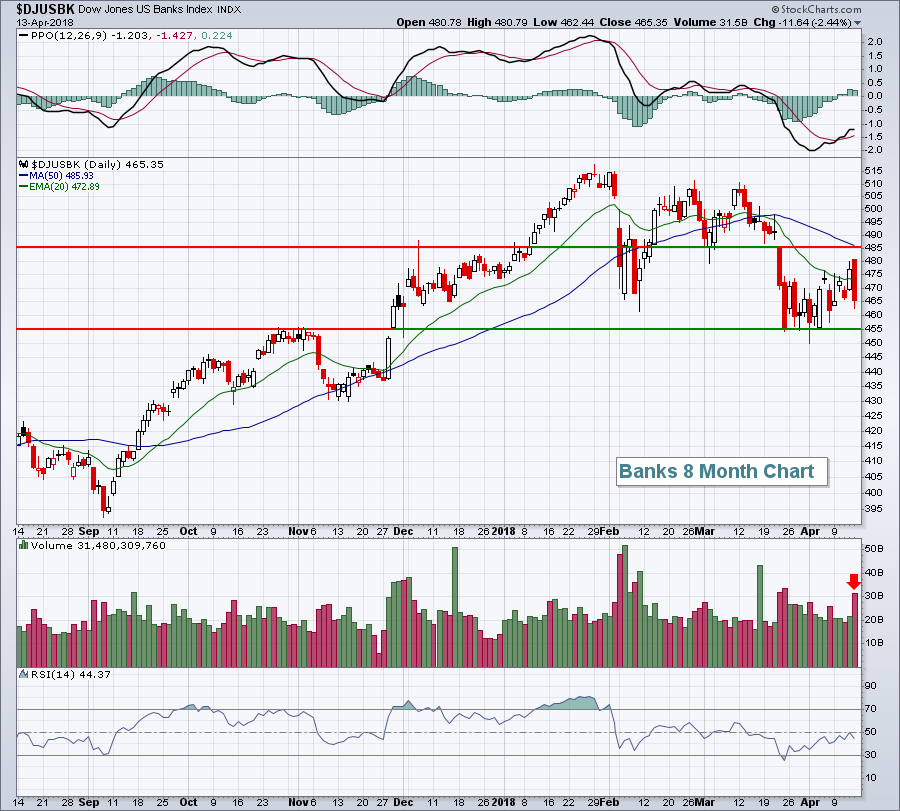 Friday's candle was a bearish engulfing candle and the entire candle is in the middle of very important support and resistance. I now view 455 as a major support level for the DJUSBK, while gap, price and 50 day moving average resistance have all converged at 485. Clearing 485 would be a "full speed ahead" signal to me for banks. Until then, I'd remain cautious.
Energy (XLE, +1.10%), utilities (XLU, +0.79%) and consumer staples (XLP, +0.50%) were the winners on Friday as traders looked to the suddenly-bullish energy group and the two defensive sectors for profit opportunities. The former continued its recent surge and is featured in the Sector/Industry Watch section below. Consumer staples benefited from a strengthening tobacco industry ($DJUSTB). However, this space has overhead resistance of its own:
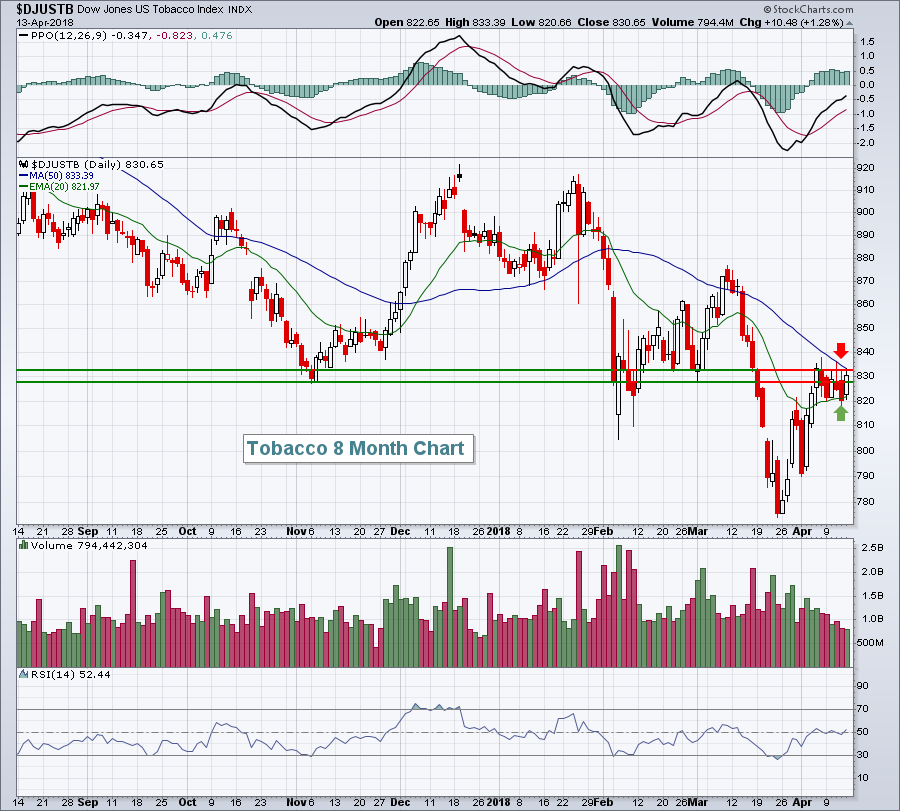 Tobacco has bounced off oversold conditions, but note that the volume throughout the advance has been declining. There have been struggles of late in the 830s and the 50 day SMA is currently at 833. Clearing and closing above recent price highs would be bullish. However, I'd respect that intermediate- to long-term downtrend until those price highs are cleared.
Pre-Market Action
U.S. futures are set to rise this morning as Syrian tensions have eased considerably following a successful missile attack on Friday by the U.S. and its British and French allies. This morning, March retail sales eased past consensus estimates (+0.6% vs +0.4%), but the April empire state manufacturing survey came up short of estimates.
Treasury prices are down, sending yields higher. The 10 year treasury yield ($TNX) is up three basis points to 2.86% this morning and Bank of America (BAC) reported better-than-expected EPS. Both should help banks stabilize after a big selloff on Friday after early morning strength. M&T Bank (MTB), however, also beat its EPS estimates, yet is down nearly 5%. I have seen reports of an earnings miss from MTB, but Zacks is showing a 2.94 vs 2.74 earnings beat. The price reaction this morning is clearly negative though and that will likely have banks ($DJUSBK) in the spotlight once again.
Dow Jones futures are up 161 points with 45 minutes left to the opening bell.
Current Outlook
Technology (XLK) ended the session on Friday with a key hammer printing on its hourly chart at rising 20 hour EMA support. The intrahour low of 66 also marked fairly important short-term support:
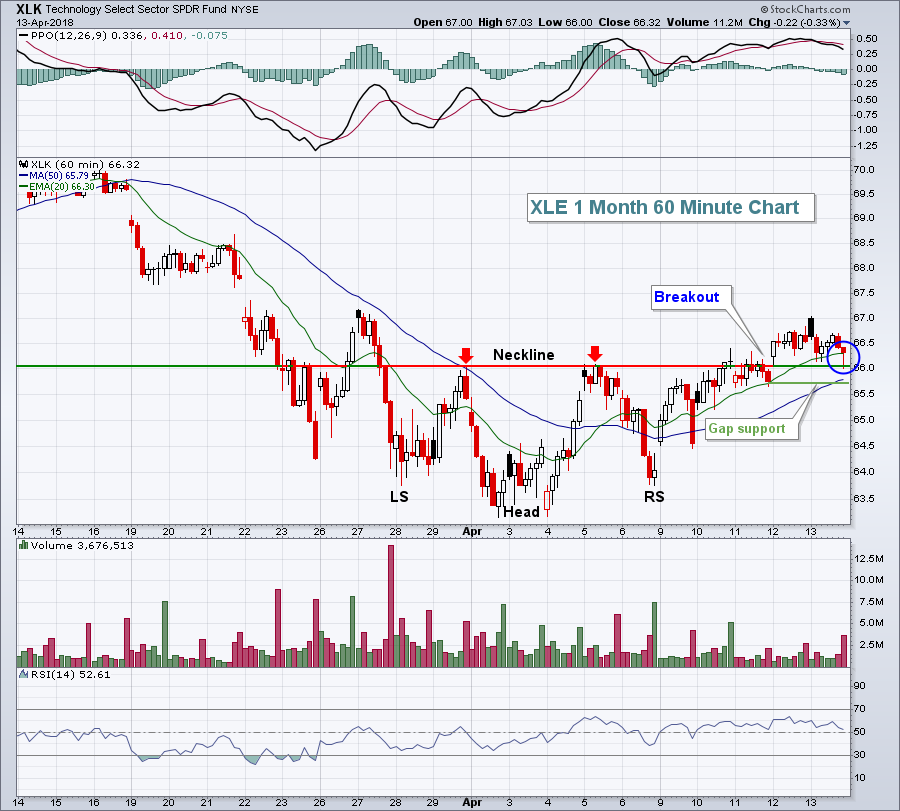 The early April weakness also marked the reverse head in what appears to be a bottoming reverse head & shoulders pattern. If that's the case, neckline support near 66.00 and gap support closer to 65.70 needs to hold on any period of short-term weakness.
Sector/Industry Watch
Energy (XLE) made a very significant price breakout above 69 last week and its strength and momentum is accelerating. The XLE now sports a SCTR of 93, the highest among all sectors and that underscores the current relative strength in this space:
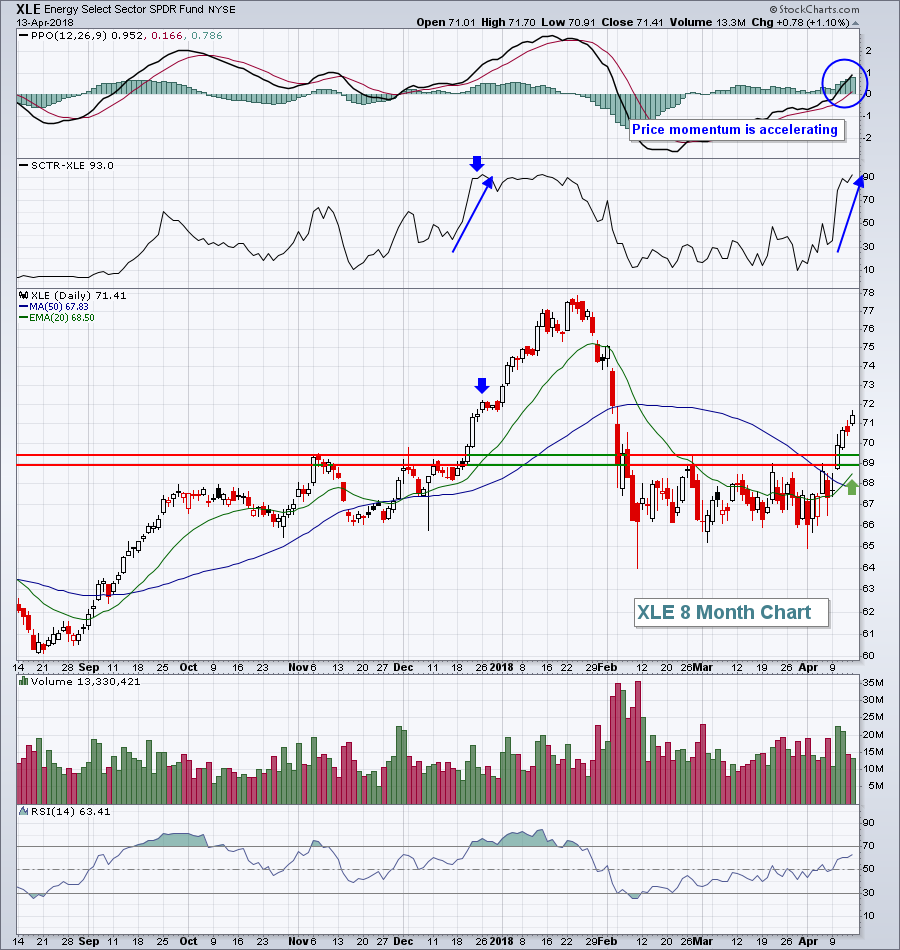 Note the pickup in volume last week as the XLE broke out. I'm not a huge fan of evaluating volume in an ETF as the direction of the ETF will follow its underlying basket of stocks regardless of volume, but I do believe this increase suggests that the interest among traders is growing and that can't be a bad thing for energy.
Monday Setups
I'm going to take a chance this week on a small homebuilder - Tri Pointe Homes Inc (TPH). The stock showed significant relative strength vs. its peers last week, while the home construction group ($DJUSHB) as a whole tumbled vs. the S&P 500. TPH also recent broke its downtrend line and last week's pullback retested the trendline and the rising 20 day EMA (green arrow):
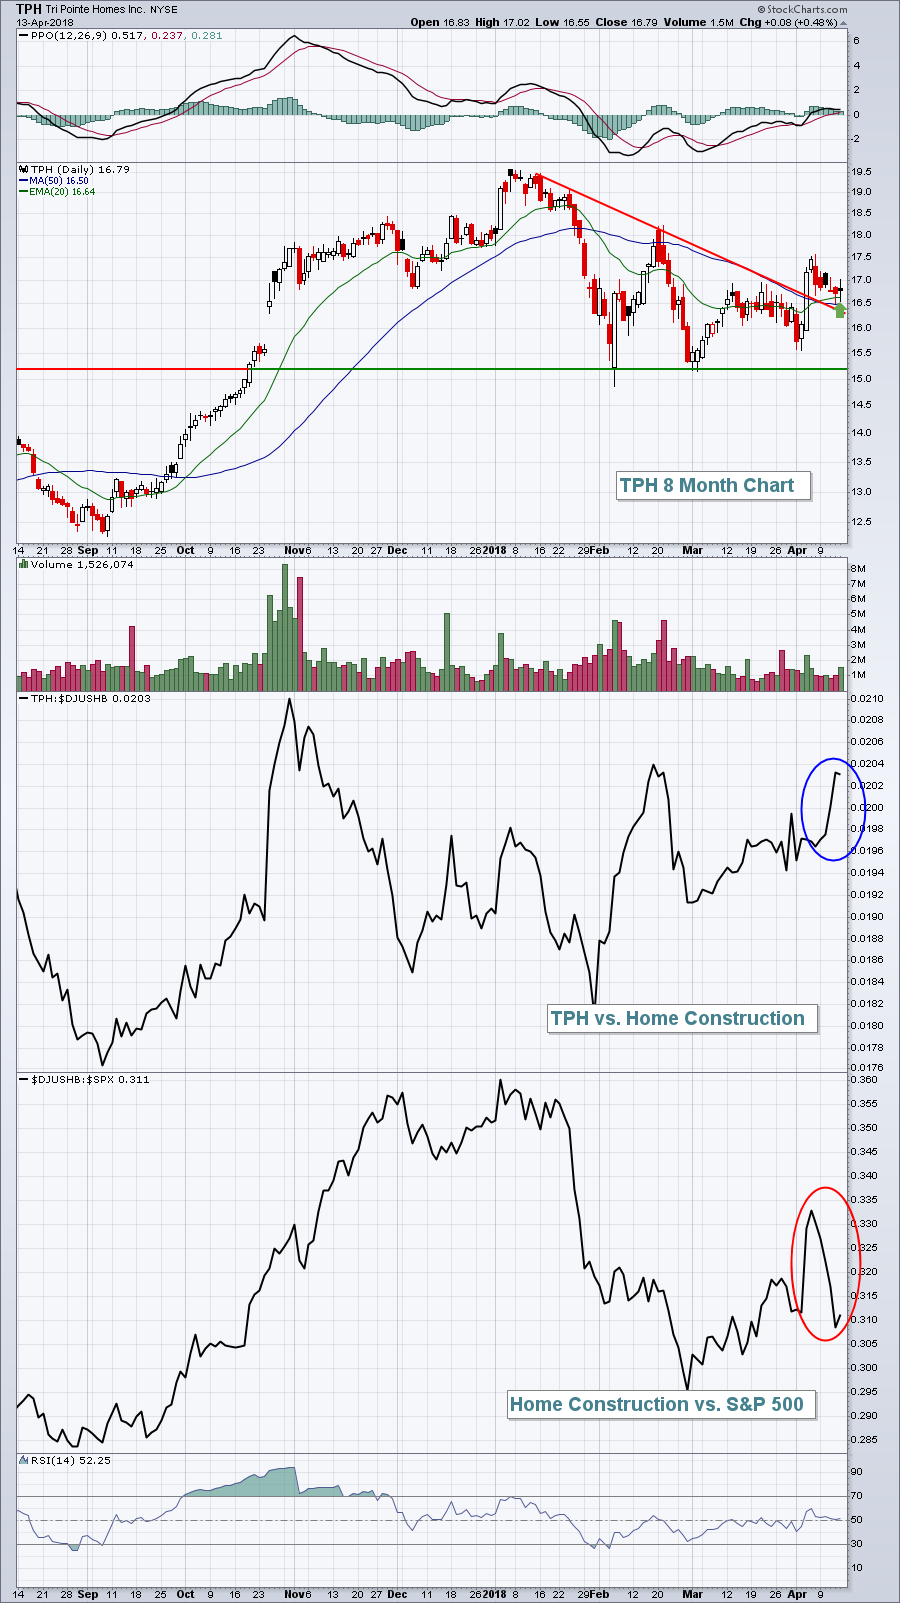 I'd look for a quick test of overhead price resistance near 17.50. If that level is cleared, 18.20 would be next.
It's been a volatile last couple of months, so I've hesitated to provide trade setups. However, this week I've featured TPH and three others that look very interesting to me. You can find these setups by CLICKING HERE.
Historical Tendencies
Since 1950, tax day and a few days following tax day have produced very bullish results on the S&P 500. April 15th through 18th have generated annualized returns of +57.44% (more than six times the 9% return that the S&P 500 enjoys throughout the year). Furthermore, there's been a 61.6% chance of April 15th through 18th producing an up day vs. the 53.3% chance throughout the year.
Key Earnings Reports
(actual vs. estimate):
BAC: .62 vs .59
JBHT: 1.07 vs 1.09
MTB: 2.94 vs 2.74
(reports after close, estimate provided):
CE: 2.36
NFLX: .63
Key Economic Reports
March retail sales released at 8:30am EST: +0.6% (actual) vs. +0.4% (estimate)
March retail sales ex-autos at 8:30am EST: +0.2% (actual) vs. +0.2% (estimate)
April empire state manufacturing survey released at 8:30am EST: 15.8 (actual) vs. 18.2 (estimate)
February business inventories to be released at 10:00am EST: +0.6% (estimate)
April housing market index to be released at 10:00am EST: 70 (estimate)
Happy trading!
Tom


