Market Recap for Monday, April 2, 2018
It was a big down day on Wall Street with eight of nine sectors down 2% or more. Only the defensive utilities (XLU, -0.77%) were able to minimize its losses, with the more aggressive consumer discretionary (XLY, -2.82%) and technology (XLK, -2.38%) hit much harder. The Dow Jones tested its low from a week earlier, while the benchmark S&P 500 managed to close at 2581, the same low it reached in early February:
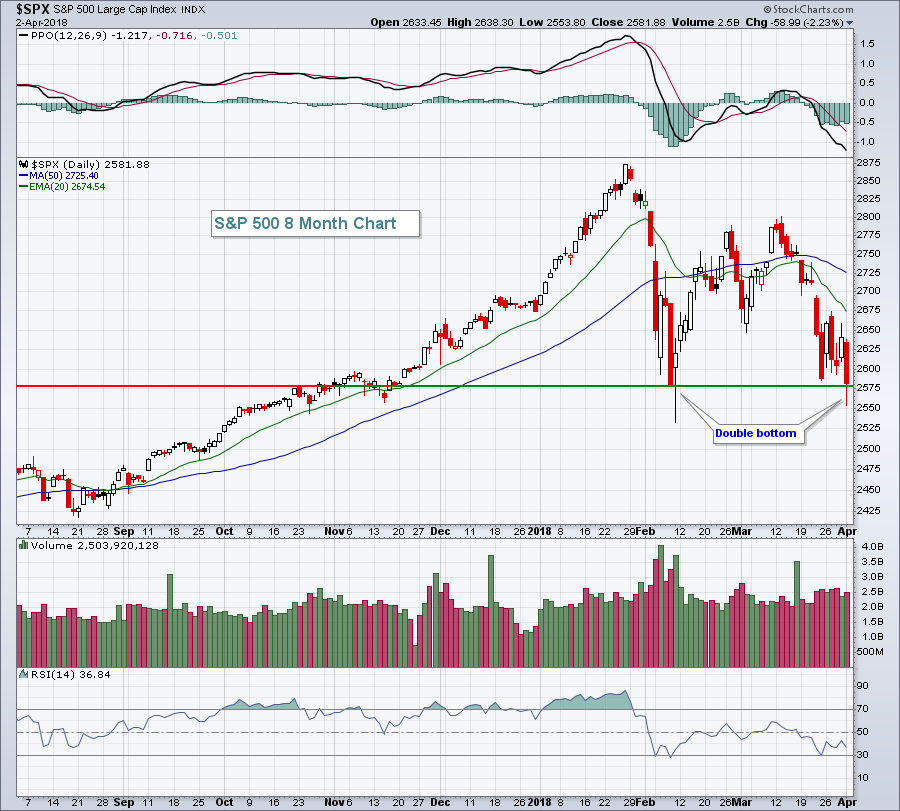 This certainly doesn't guarantee we'll see higher prices near-term, but it is an area where the S&P 500 found buyers in early February. It would be unusual to lose a key short-term support as the market anticipates earnings season.
Health care providers ($DJUSHP) was one of only four industry groups that managed to finish in positive territory on Monday. (Mining, gold mining and marine transportation were the other industry groups to advance.) Humana (HUM) was the best performing stock in the S&P 500 as discussions surrounded WalMart's (WMT) potential takeover of the health care provider.
There were only 12 S&P 500 stocks that finished higher and half of them were either utilities or health care providers.
Pre-Market Action
Despite Wall Street's selling episode on Monday, markets in both Asia (overnight) and Europe (this morning) are holding up well. Dow Jones futures are pointing to a rebound at the open, up 78 with a little less than 2 hours before the opening bell.
Current Outlook
The XLY:XLP ratio has struggled the past two weeks after a steady climb since August 2017. The relative strength did show signs of slowing upward momentum, however, as a negative divergence printed on the most recent high:
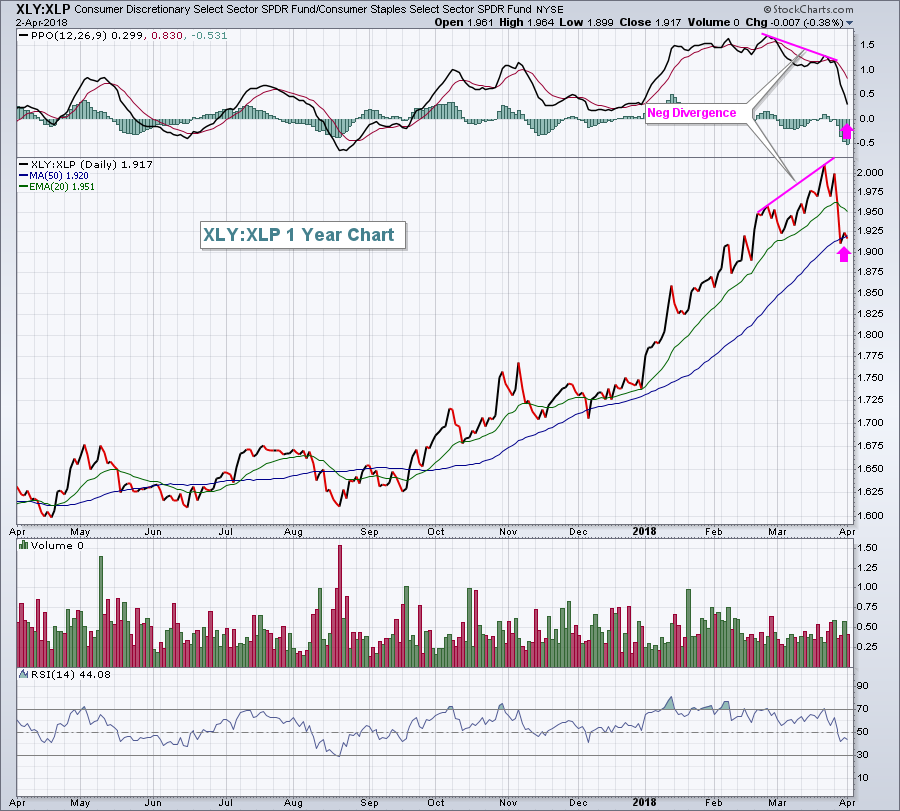 Consumer discretionary had solidly outperformed its staples counterpart for months, but the slowing momentum issue finally resulted in a 50 day SMA test. Also, the relative RSI is approaching 40 - a level where we should expect a reversal.
Sector/Industry Watch
Biotechnology stocks ($DJUSBT) have been very weak since late January, but really need a reversing candle this week to avoid a significant breakdown. There was a negative divergence in play so testing the 50 week SMA was not a big deal, but the poor start to this week leaves the index vulnerable to more selling:
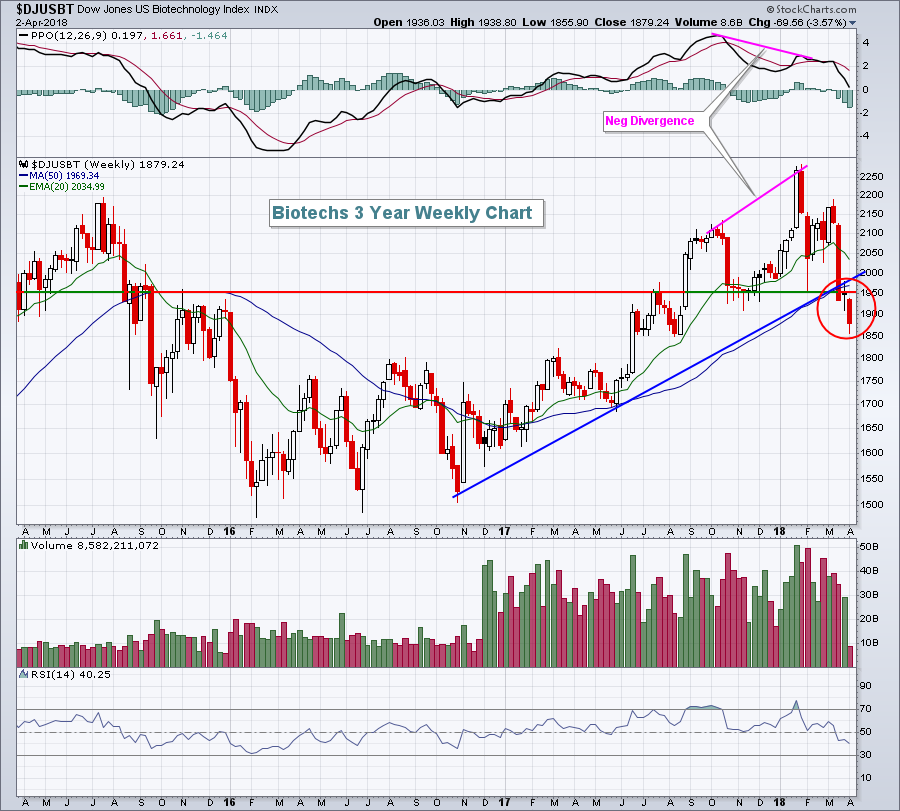 The red circle highlights the trendline break and the loss of price support from the fourth quarter. It's also worth noting that the weekly RSI has touched 40 and that's typically a very important level if the uptrend is to continue. Keep in mind that the current candlestick is not final until the close on Friday. If the longer-term uptrend is to remain in play, it's important to see a bullish reversal this week.
Historical Tendencies
While the S&P 500 and NASDAQ show most of their historical April strength in the first half of the month, the Russell 2000 actually sees much more historical strength in the second half of April. Here's the historical breakdown on small caps since 1987:
April 1-15: -5.62%
April 16-30: +36.87%
Key Earnings Reports
None
Key Economic Reports
None
Happy trading!
Tom


