Market Recap for Wednesday, April 25, 2018
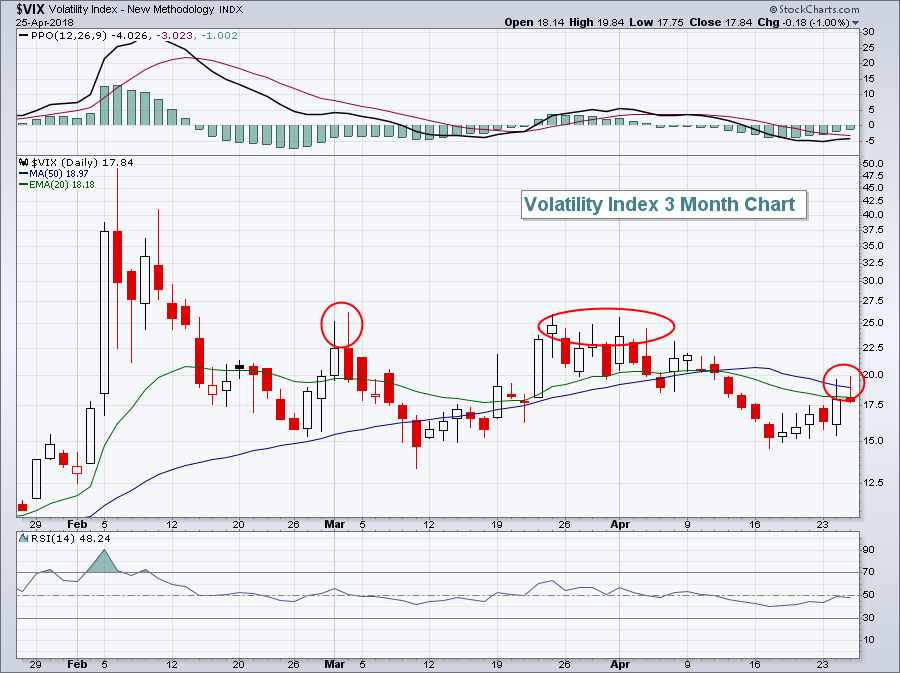
Wall Street was able to find equity buyers yesterday, despite the 10 year treasury yield's ($TNX) first close above 3.00% since 2014. The Volatility Index ($VIX) settled back down after approaching 20 for the second consecutive day. It has closed well off its intraday highs both days, however, and that could be a signal of a short-term top in volatility:
 Volatility has really been one of the biggest stories of 2018, if not the biggest. It's always welcome relief to see the VIX mark potential tops so we'll see if the bulls can take advantage in today's session.
Meanwhile, we finished with bifurcated action on Wednesday, with both the Dow Jones and S&P 500 posting fractional gains while the NASDAQ and Russell 2000 finished barely in negative territory. Many sectors also ended the day nearly flat, although we did see a bit of relative strength in energy (XLE, +0.79%) and materials (XLB, +0.54%).
Among industry groups, railroads ($DJUSRR, +3.01%) rallied off of 20 day EMA support and was easily the best performing group among industrials. Boeing (BA) led a rally in aerospace stocks ($DJUSAS, +1.77%) as well. Gambling ($DJUSCA, -2.01%) and defense ($DJUSDS, -2.38%) were among the lagging industries.
Pre-Market Action
Economic reports out this morning were all indicative of a strengthening economy. Initial jobless claims were well below expectations, while March durable goods easily surpassed expectations. That latter report, however, does tend to be extremely volatile with one month's extreme beat often times followed up with a big miss the next month. Despite the apparent strengthening of our economy, traders are a bit more interested in treasuries today, with the 10 year treasury yield ($TNX) falling back to 3.0%. Perhaps it's simply an oversold bounce in treasuries, which have sold off hard in recent days with the TNX testing 4 year highs near 3.05%.
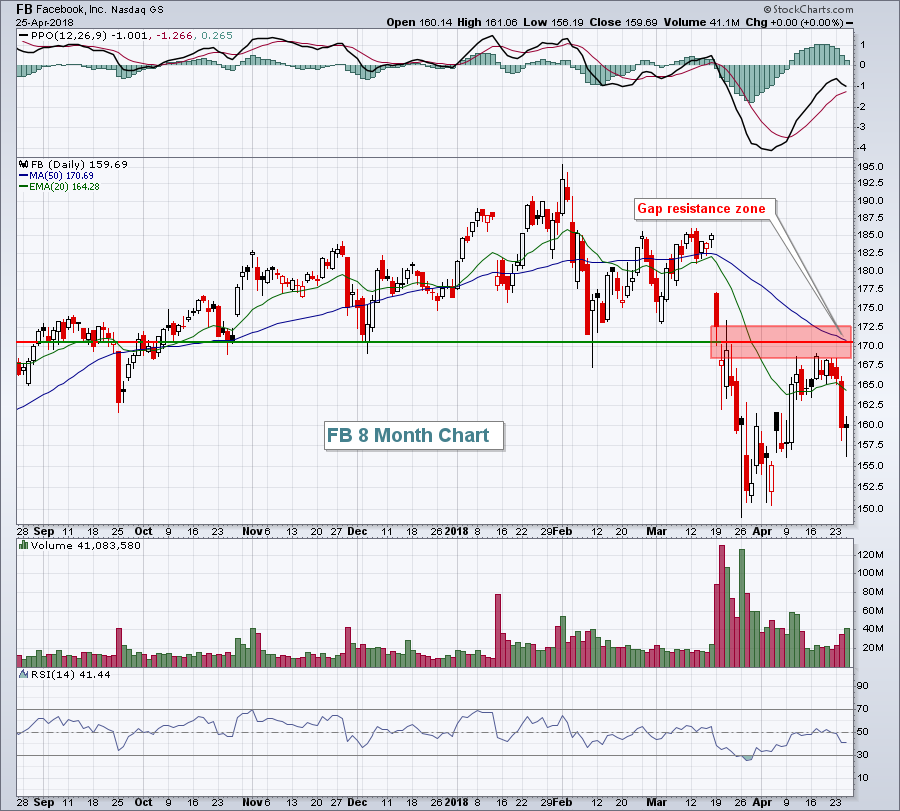
Facebook (FB) blew out revenue and earnings expectations on Wednesday after the closing bell and traders are rewarding the stock with a big advance in pre-market trading. The question is.....will FB be able to extend its advance through key resistance after the opening bell?
 There was a lot of volume (ie, a lot of sellers) on that mid-May selloff. Will those sellers return as FB gaps back to that same area? We'll find out later today.
There are a ton of earnings out today, some of which already were released this morning, but check out this lineup tonight: AMZN, MSFT, INTC, SBUX, BIDU.
Dow Jones futures are higher this morning by 57 points, or roughly 0.25%. NASDAQ futures are much stronger, though, with opening gains of 0.75% potentially.
Current Outlook
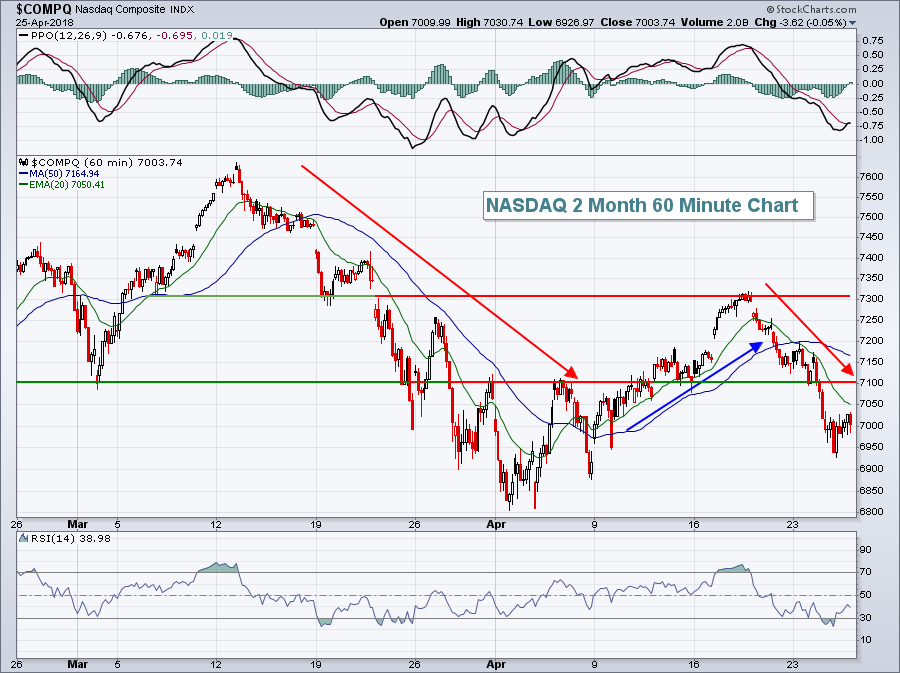
The pre-market action looks solid, but just beware that overhead resistance on a 60 minute chart typically lies with the 20 hour EMA. One look at the NASDAQ's hourly chart suggests today's opening gap will be nice, but what happens after the opening gap is what matters most:
 When we look across the past couple months, 7100 has acted as solid support and resistance on multiple occasions. Therefore, I see two primary obstacles ahead for the NASDAQ. First, we must clear the falling 20 day EMA. Perhaps we'll get that test early in today's session. Then we'll face that 7100 price resistance. The hourly PPO has begun to turn higher, so if weakness resumes later in the session and we take out the lows from this week, we could see a positive divergence form as we move deeper into the historically bullish April 25th to May 5th period - the NASDAQ has produced annualized returns of +31.03% during this period since 1971.
Sector/Industry Watch
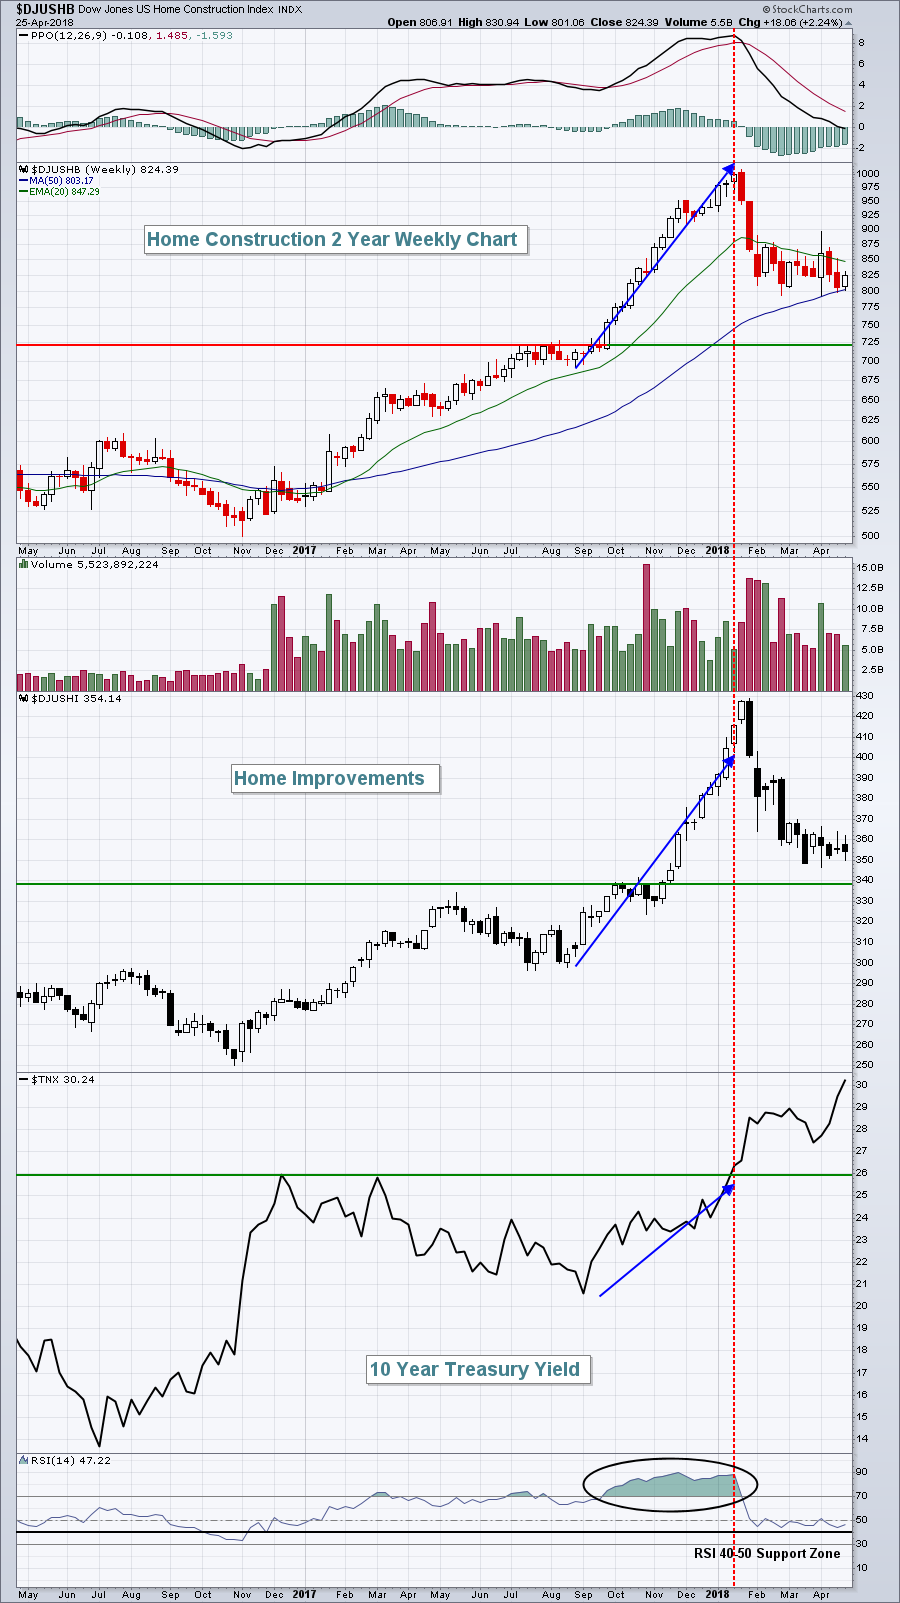
Home-related stocks have taken more than their fair share of hits during the past three volatile months. Within the consumer discretionary sector, furnishings ($DJUSFH, -18.34%), home improvements ($DJUSHI, -16.33%) and home construction ($DJUSHB, -13.90%) have been awful relative performers. Sometimes, big declines follow big advances and that's what appears to be the case here, especially with the latter two:
 The media will paint the picture that rising interest rates will squash home construction....and it makes sense to some degree. But interest rates are still extremely low and a strengthening economy and more jobs will continue to bolster home construction stocks in my opinion. They were very overbought, evidenced by weekly RSI at 90! Let's give the group the opportunity to consolidate. I expect to see leadership here again during 2018.
Historical Tendencies
We're rapidly approaching May and the old Wall Street adage says to "go away in May". It is true - the May through October performance badly lags November through April. But to simply go away and avoid the stock market altogether is a huge mistake in my opinion as there are very bullish pockets in various market indices throughout the May through October period.
Here are the annualized returns for May in each of our key indices:
S&P 500 (since 1950): +2.84% (May has risen 40 times, fallen 28 times; ranks 8th among all calendar months)
NASDAQ (since 1971): +10.88% (May has risen 29 times, fallen 18 times; ranks 5th among all calendar months)
Russell 2000 (since 1987): +14.36% (May has risen 20 times, fallen 10 times; ranks 4th among all calendar months)
Is May really all that bad?
Key Earnings Reports
(actual vs. estimate):
ABBV: 1.87 vs 1.80
ALXN: 1.68 vs 1.48
APD: 1.71 vs 1.68
BAX: .70 vs .62
BCS: .33 (estimate, still awaiting results)
BMY: .94 vs .85
CME: 1.86 vs 1.85
COP: .96 vs .74
GM: 1.43 vs 1.22
HLT: .55 vs .51
ITW: 1.90 vs 1.85
LUV: .75 vs .75
MO: .95 vs .93
NOK: .02 vs .03
PEP: .96 vs .92
PX: 1.65 vs 1.56
RDS.A: 1.28 vs 1.24
RTN: 2.20 vs 2.10
TWX: 2.28 vs 1.76
UNP: 1.68 vs 1.65
UPS: 1.55 vs 1.54
XEL: .57 vs .51
VLO: 1.00 vs .93
ZBH: 1.91 vs 1.87
(reports after close, estimate provided):
AMZN: 1.22
BIDU: 1.73
DFS: 1.77
EXPE: (.60)
FTV: .74
INTC: .71
KLAC: 1.98
MSFT: .85
MXIM: .69
SBUX: .53
SYK: 1.60
VRTX: .58
WDC: 3.31
Key Economic Reports
Initial jobless claims released at 8:30am EST: 209,000 (actual) vs. 230,000 (estimate)
March durable goods released at 8:30am EST: +2.6% (actual) vs. +1.7% (estimate)
March durable goods ex-transports released at 8:30am EST: +0.0% (actual) vs. +0.5% (estimate)
Happy trading!
Tom


