Market Recap for Friday, May 11, 2018
Considering the gains that the bulls enjoyed earlier in the week, Friday's end-of-day numbers weren't too shabby. Only the NASDAQ (-2.09 points) lost ground. Over the six prior sessions, the NASDAQ moved from its intraday low on May 3rd of 6991 to Friday's close at 7403. That's a huge rally so losing 2 points doesn't seem like a particularly big deal.
The Dow Jones was the relative leader on Friday, posting a gain of 92 points to close at 24831, its highest close in nearly two months. Technically, however, let's keep an eye on the small cap Russell 2000 index, which is now churning just beneath an all-time high close of 1611:
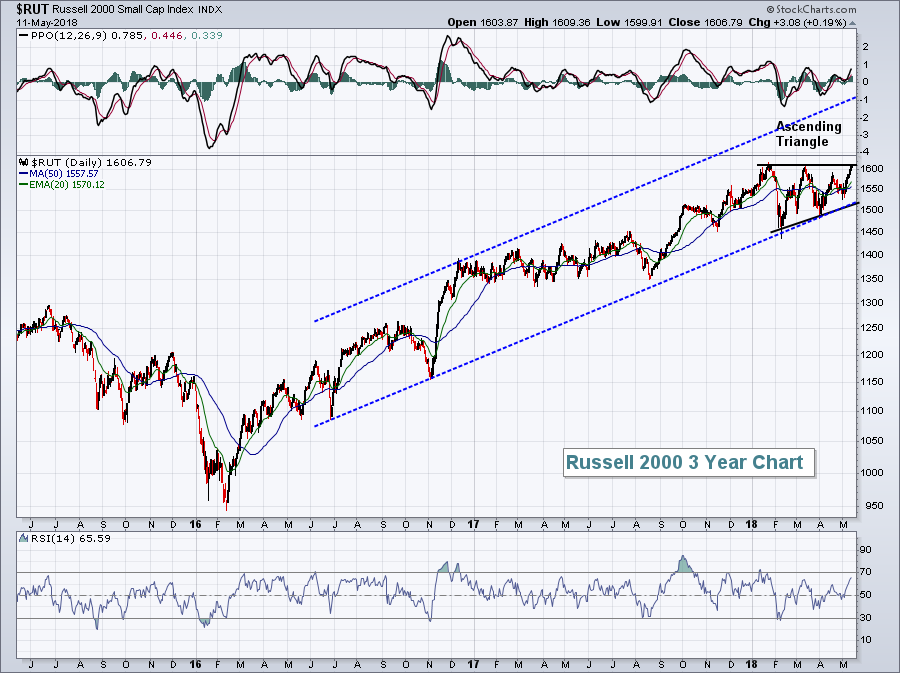 A breakout of the current ascending triangle pattern would measure to approximately 1780. The blue-dotted lines mark what could be a longer-term up channel. The ascending triangle breakout could be a signal that a big move is in the cards to establish the next connecting point in the upper trendline.
Most sectors finished near the flat line on Friday. Healthcare (XLV, +1.49%) was the exception as biotech stocks ($DJUSBT) rebounded strongly, closing at its highest level in six weeks and doing so on expanded volume. Biotechs are highlighted below in the Sector/Industry Watch section.
Pre-Market Action
Bonds, gold and crude oil are all relatively flat this morning as we kick off a new trading week. Asian markets were mostly higher overnight, while prices are slipping a bit in Europe in early trade. With 30 minutes left to the opening bell here in the U.S., Dow Jones futures are higher by 52 points as this index of 30 multi-national conglomerates attempts to rally for the 8th consecutive session.
Current Outlook
Many times a daily chart and a weekly chart can provide very different technical clues. In my opinion, it's always best to look at the longer-term weekly chart to keep short-term developments in perspective. Biotechnology stocks ($DJUSBT) have not performed well in 2018. That's rather obvious when we look at a daily chart (see the daily DJUSBT chart in the Sector/Industry Watch section below). The longer-term chart, however, looks much more bullish to me. First, keep in mind that I continue to believe that we're in a continuing bull market and the struggles we've felt since January is part of a necessary correction. If you're in the bearish camp, you likely won't look at the long-term chart the way I do.
After a lengthy advance in the DJUSBT, where it ran 50% from the October 2016 low to the January 2018 high, I believe it's consolidating in bullish fashion. It'll likely take awhile to develop, but one pattern that I believe could emerge is an inverse head & shoulders pattern. The following chart illustrates what would need to happen:
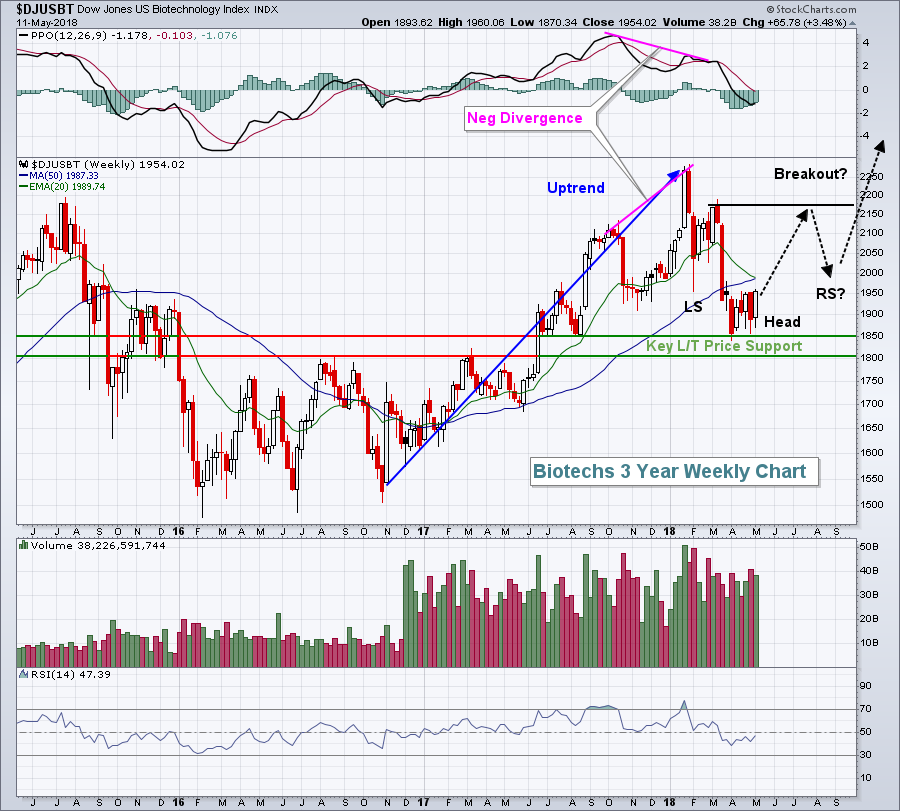 In an inverse head & shoulders pattern, the inverse head should not fall more than 50% of the prior advance. Therefore, the price support zone that I've marked in the 1800-1850 area should not be violated. Another piece of this bullish puzzle is that uptrending indices/stocks/etc. tend to hold RSI 40 support on pullbacks. Note that the weekly RSI recently dipped down to that 40 level and is now turning higher.
There's one other historical fact that should not be ignored. Over the past two decades, the best three consecutive month period for this group has been from May through July, and July has been especially bullish, rising 4.50% on average over the past 20 years. I believe the bottom is in on biotech stocks and that the reward to risk is sufficient to overweight the group.
Sector/Industry Watch
The Dow Jones U.S. Biotechnology Index ($DJUSBT) rallied more than 2% on Friday, closing above a double top that was established during April. Here's the latest chart:
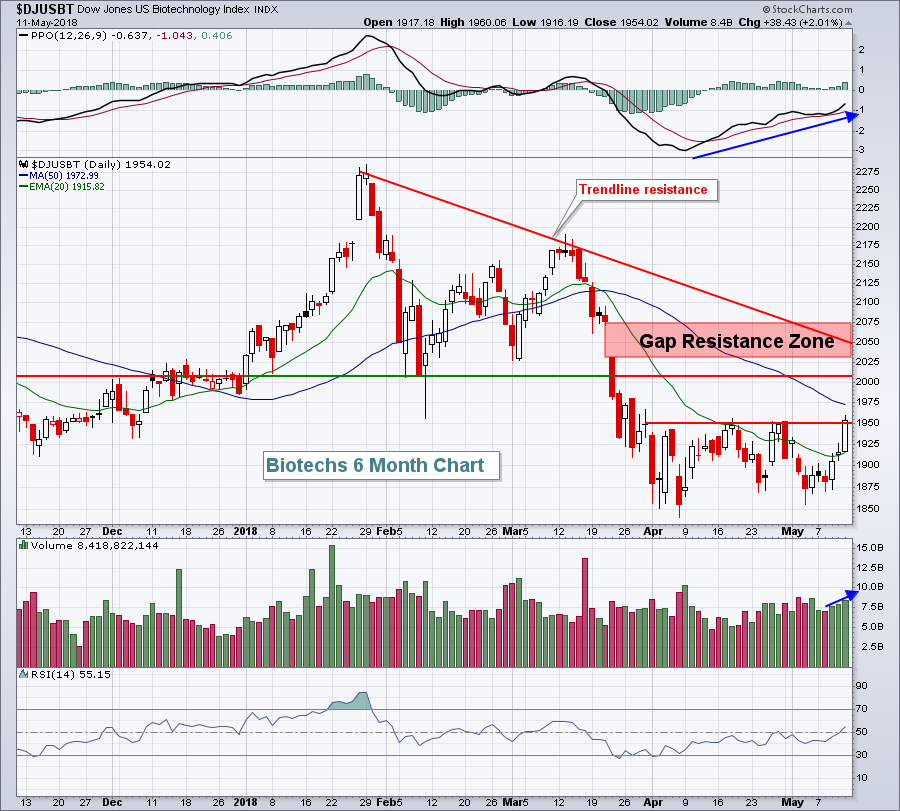 From the chart above, it's fairly clear that there remain many technical obstacles ahead for the DJUSBT. The gap resistance zone, along with trendline resistance, should provide the bulls a very difficult path to reach the March high. However, a trip back to that level would be an extremely bullish development for biotechs in the longer-term, as explained above in the Current Outlook section.
Monday Setups
Last week's setup was Teledoc, Inc (TDOC), which had a stellar week and gained roughly 12%. It'll be difficult to top that one, but let's give it a shot with Kohls, Inc. (KSS). Apparel retailers ($DJUSRA) were very strong from November 2017 through January 2018 and KSS was one of its leaders. Since then, both the group and KSS has sideways consolidated, but remain in bullish patterns so long as recent lows hold. Here's the chart:
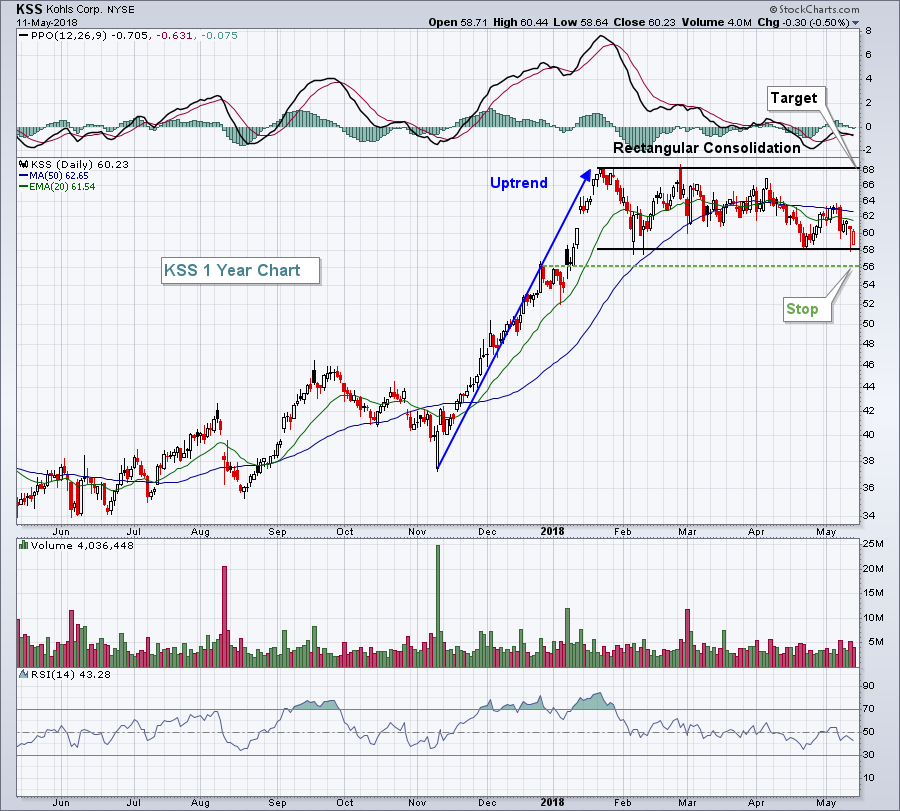 While I like the recent price support on KSS between 58-60 and I'm only looking for a short-term bounce, I do want to point out that the May/June period is not a great month for apparel retailers in general (see Historical Tendencies section below). I would still trade the technical indications, but this information might keep some traders away for now.
Historical Tendencies
The Dow Jones U.S. Apparel Index ($DJUSRA) tends to struggle as spring is sprung. Over the past 20 years, the DJUSRA has risen just 42% and 28% of the time in May and June, respectively. Furthermore, the average monthly loss for these two months is -0.6% and -1.8%, respectively. I view seasonal tendencies to be a secondary indicator. Still, given the consolidation that the group has seen for the past few months, perhaps we should expect that consolidation to continue given these not-so-great performance numbers in May and June.
Key Earnings Reports
(reports after close, estimate provided):
A: .65
VIPS: .16
Key Economic Reports
None
Happy trading!
Tom