Market Recap for Wednesday, May 30, 2018
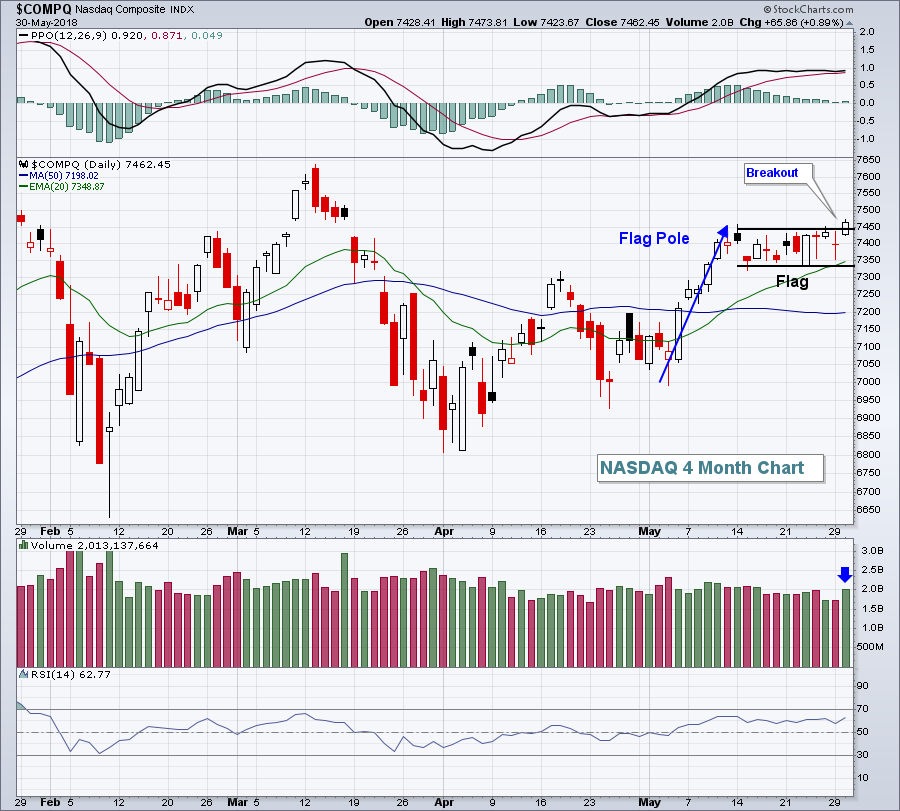
Remember that Tuesday weakness? Yeah, I didn't think so. Poof!!! It took the U.S. stock market all of one day to essentially erase the scars of that Tuesday selling. The NASDAQ broke out of a bullish flag pattern and the small cap Russell 2000 closed at yet another all-time high. Here's that NASDAQ breakout:
 From a sector perspective, the bounce back occurred in all of the areas I would've expected. Energy (XLE, +3.03%) needed a rebound and that group got it....just as crude oil prices ($WTIC) rose off key $66 per barrel support:
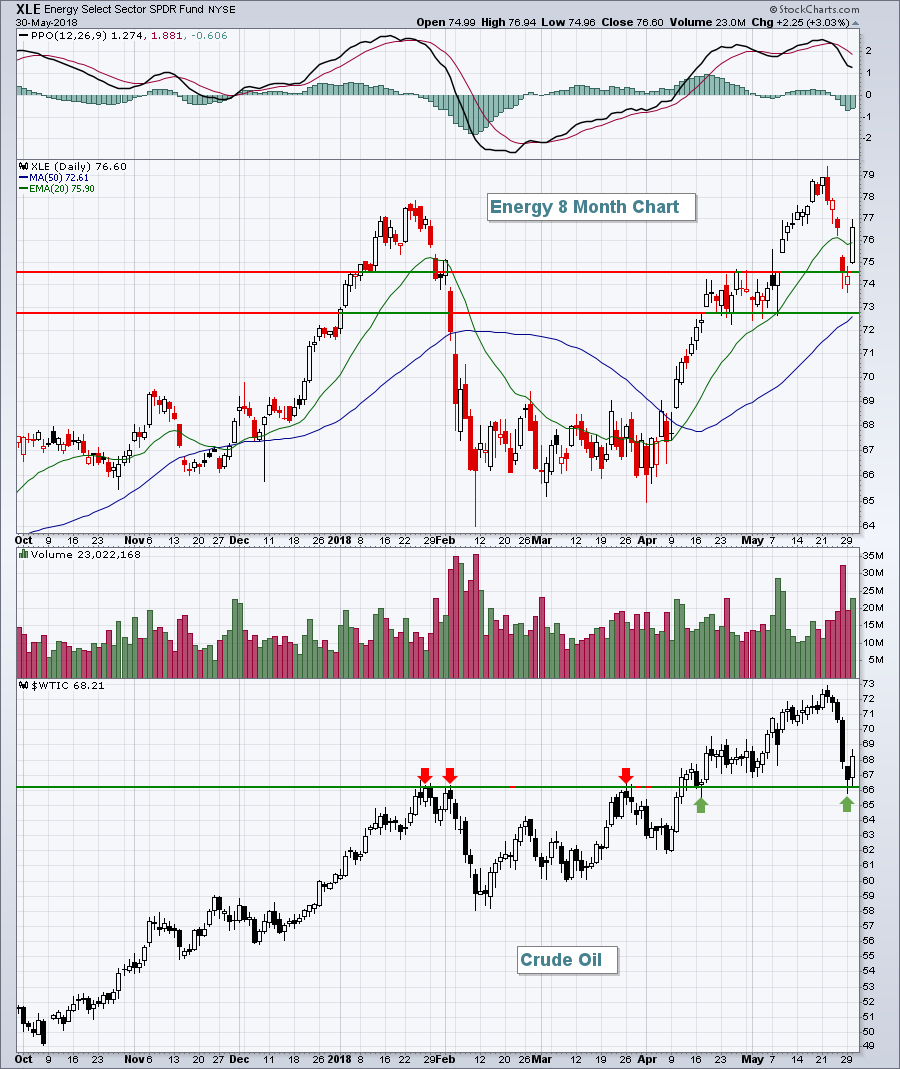 Important support levels have been established above. We don't want to see these levels violated or selling could escalate. In the meantime, treat recent highs as the upper end of a current consolidation period with the support levels highlighted the bottom end of the trading range.
Financials (XLF, +1.82%) were also strong as the 10 year treasury yield ($TNX) reversed its recent slide. The TNX jumped 8 basis points to finish Wednesday's session at 2.85%. That enabled both life insurance companies ($DJUSIL) and banks ($DJUSBK) the relief they needed as they tested price support:
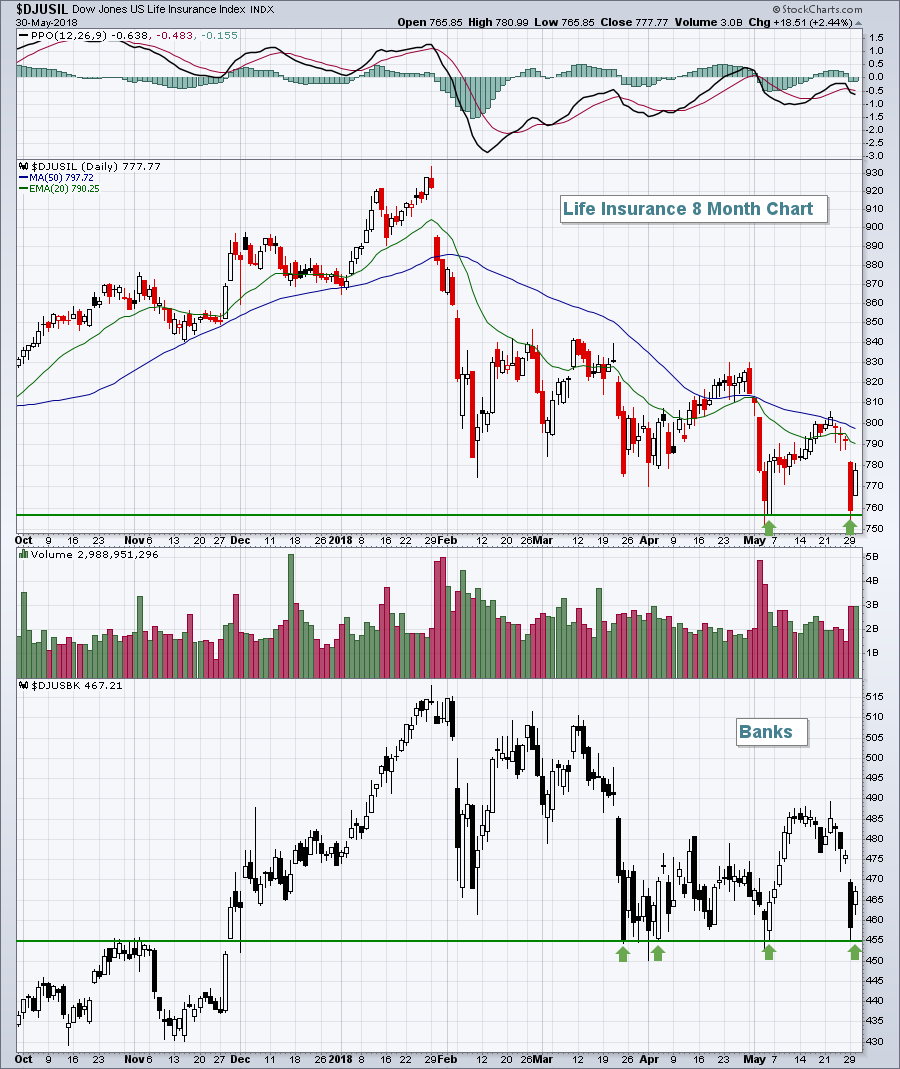 The support levels on both of these indices should be watched very closely as selling could accelerate quickly if they're lost.
Pre-Market Action
Treasury yields and gold ($GOLD) both are flat today, but there's weakness in crude oil prices ($WTIC) that could result in some profit taking in the Wednesday energy (XLE) rally.
Asian markets were significantly higher overnight, while European markets are mixed this morning.
With less than 30 minutes to the opening bell, Dow Jones futures are up 12 points in an attempt to continue yesterday's solid rally.
Current Outlook
One positive that's been taking place beneath the surface of the market is that transports ($TRAN) have been showing relative strength vs. utilities ($UTIL), despite an overall lower benchmark S&P 500:
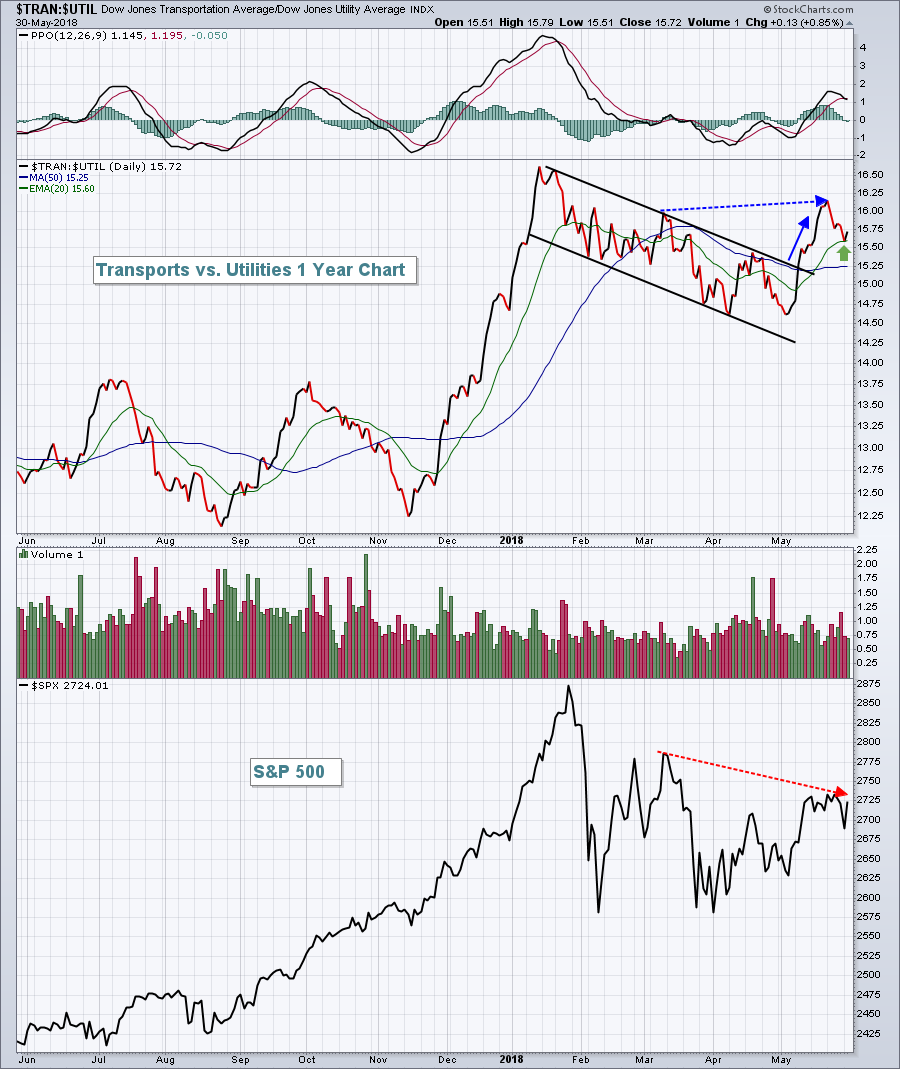 This ratio recently broke its relative downtrend and is strengthening, which is a bullish development for our future economic outlook. There are lower peaks on the S&P 500 since March, but rising peaks on the TRAN:UTIL ratio. Under the surface, money is rotating in bullish fashion toward transportation stocks and away from utilities and the only reason for that is market participants are looking ahead and seeing a strengthening U.S. economy.
Sector/Industry Watch
The Dow Jones U.S. Health Care Providers Index ($DJUSHP) had been consolidating in a very bullish inverse head & shoulders pattern during the recent market volatility. That pattern has seen a breakout, a test of rising 20 day EMA support, and it's on the verge of another breakout. These are bullish developments that will likely carry the index much higher:
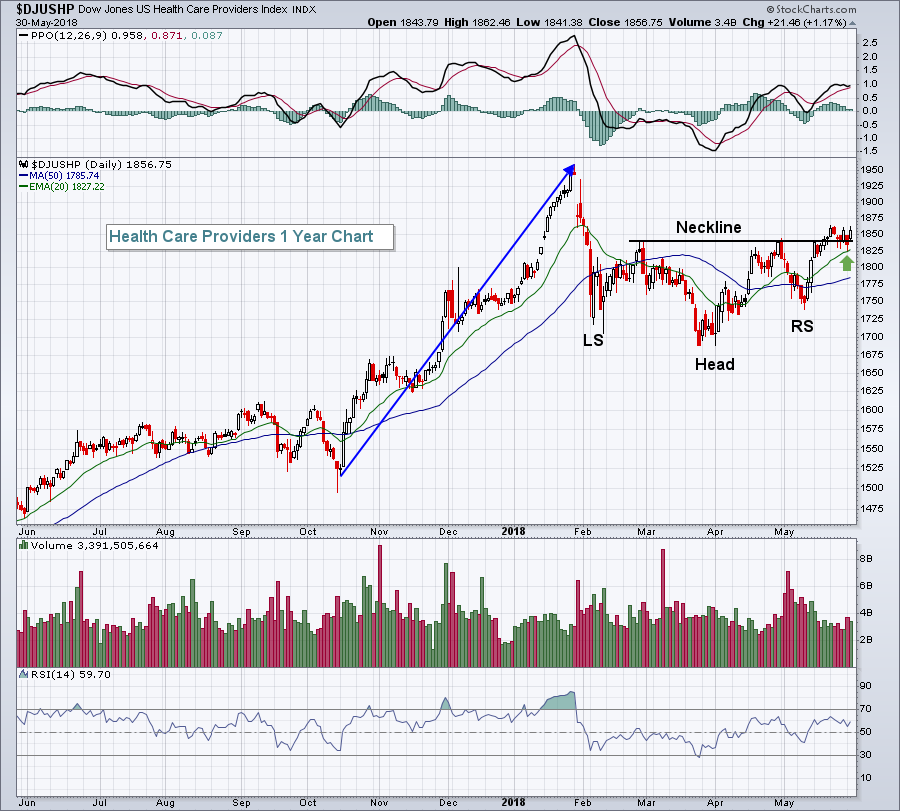 Small caps have outperformed their larger cap counterparts, so looking for small cap health care providers makes a lot of sense given the strengthening of this industry group.
Historical Tendencies
Well, it's the 31st day of May. The last trading day of the month has traditionally been a very bullish one. So it should be no surprise that the 31st of all calendar months has produced solid annualized returns. Those returns are as follows on each of the following major indices:
S&P 500 (since 1950): +29.99%
NASDAQ (since 1971): +48.75%
Russell 2000 (since 1987): +75.45%
Key Earnings Reports
(actual vs. estimate):
BURL: 1.26 vs 1.09
DG: 1.36 vs 1.40
DLTR: 1.19 vs 1.23
(reports after close, estimate provided):
COST: 1.51
LULU: .46
MRVL: .31
ULTA: 2.48
VMW: 1.14
WDAY: .26
Key Economic Reports
Initial jobless claims released at 8:30am EST: 221,000 (actual) vs. 224,000 (estimate)
April personal income released at 8:30am EST: +0.3% (actual) vs. +0.3% (estimate)
April personal spending released at 8:30am EST: +0.6% (actual) vs. +0.4% (estimate)
May Chicago PMI to be released at 9:45am EST: 58.4 (estimate)
April pending home sales to be released at 10:00am EST: +0.4% (estimate)
Happy trading!
Tom


