Market Recap for Tuesday, May 22, 2018
After early morning strength, Wall Street sellers returned and took their toll on many areas of the market, but most notably energy (XLE, -1.33%) and industrials (XLI, -1.23%). Heavy construction ($DJUSHV) was a key casualty in the industrials after trying to reverse its recent bearish technical picture:
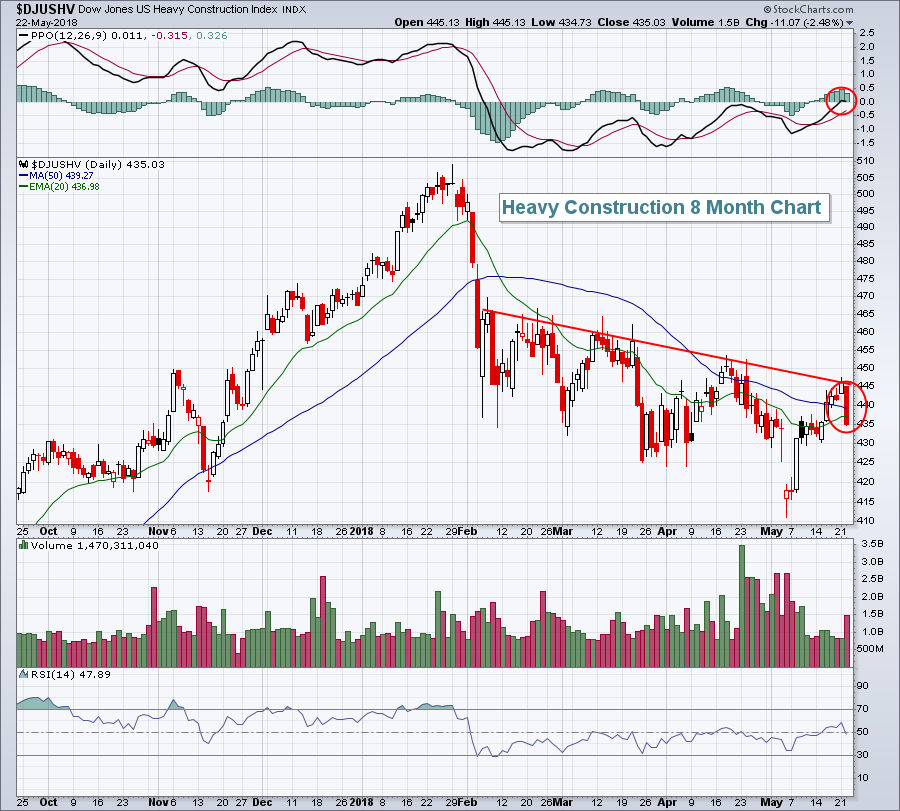 Trendline resistance has been difficult to clear since the early-February selling took its toll technically on this group. The increase in volume and bearish red-filled candle really put an exclamation point on this resistance area. If there were hopes that an uptrend had begun, the loss of both key moving averages (20 day and 50 day) likely put that to rest.
In the energy world, exploration & production stocks ($DJUSOS) simply hit some profit taking. It's been mostly an unabated run higher since early-April and the space needed a rest. The reversal on Tuesday with increasing volume could lead to an upcoming 20 day EMA test:
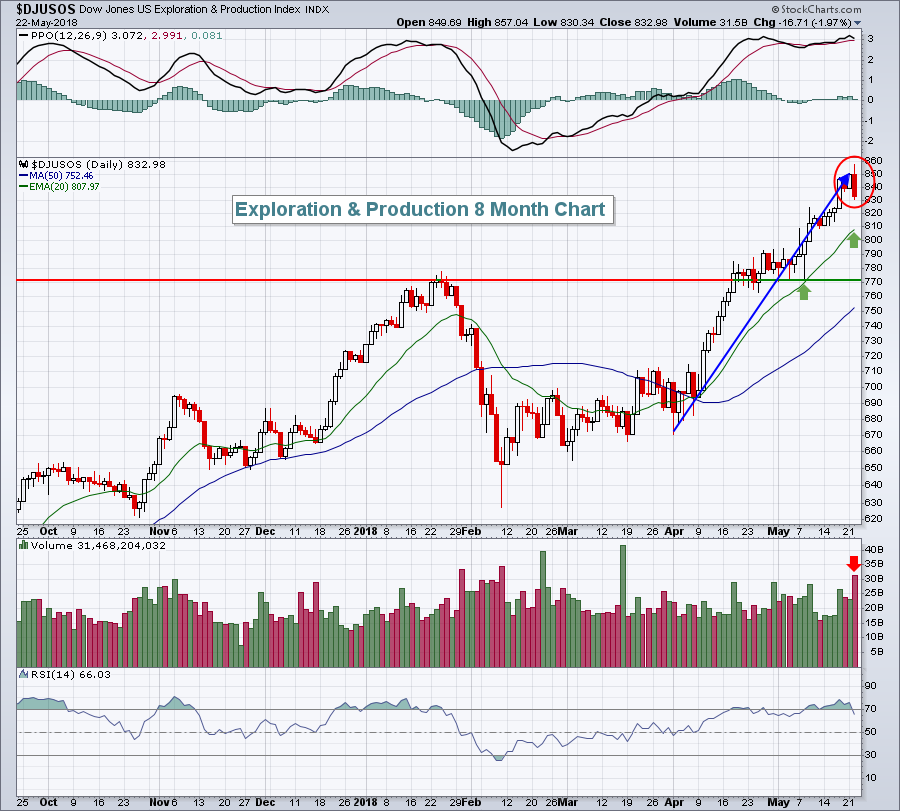 The red arrow shows that volume accelerated on Tuesday's selling, a further sign that a short-term top is likely in place. The blue directional line illustrates the 20% rise in the DJUSOS in just seven weeks.
Financials (XLF, +0.67%) were the big relative winner and sector leaderboard champ yesterday as banks ($DJUSBK) performed well, perhaps responding to the recent surge in the 10 year treasury yield ($TNX). But the XLF printed what appears to be a false breakout, a signal of a possible near-term top:
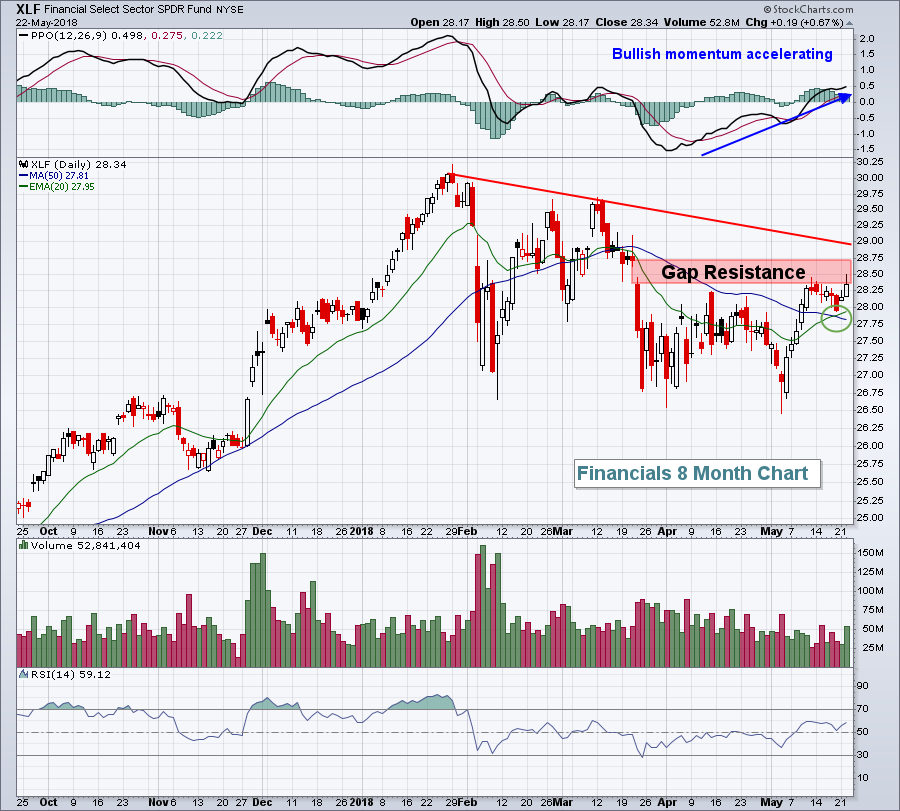 The XLF is one of the most interesting sector charts. We see a bullish golden cross (green circle) where the short-term 20 day EMA has crossed above the longer-term 50 day SMA. Thus far, recent profit taking has held above that rising 20 day EMA, a bullish development and one indicative of an uptrend. But overhead resistance is clearly marked. There's a gap resistance zone that was penetrated intraday on Tuesday, only to fail. Then there's a declining trendline just above the gap resistance zone. Which way do the financials go? I believe they'll follow treasury yields higher, but a move back beneath 27.90 or so on a closing basis would not help that argument.
Pre-Market Action
Weakness into Tuesday's close combined with poor earnings and global stock market weakness has Dow Jones futures reeling this morning. With less than an hour to the opening bell, Dow Jones futures are lower by 178 points.
Target (TGT) and Lowe's (LOW) missed both revenue and earnings forecasts. However, traders are treating the two companies quite differently as LOW is up more than 3% in pre-market action, while TGT is tumbling, down more than 5%.
After a couple of quiet mornings from an economic perspective, we'll get April new homes sales data at 10:00am EST. Home construction stocks ($DJUSHB) could use some good news, especially after yesterday's 3% drop. FOMC minutes will be released at 2:00pm EST.
Current Outlook
For the first time this month, it appears we might see some profit taking in the small cap Russell 2000 ($RUT). It's been a great ride, but the finish on Tuesday indicates the recent high might be the end of the short-term rally. It's not unusual during uptrends to find support at rising 20 day EMAs and that moving average on the RUT is currently at 1595, roughly 2% below the current index value. On an hourly chart, there a couple of key support levels to watch, the more meaningful being just beneath 1595:
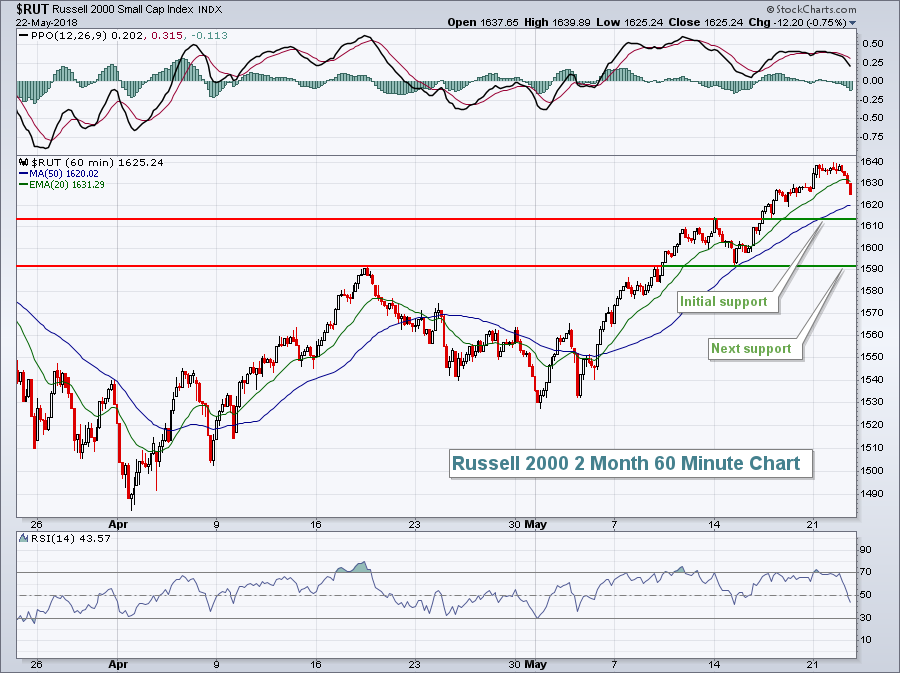 Small caps have been the clear market leader for the past couple months, but they could see a bit of relative weakness if profit taking sticks for more than just a day or two.
Sector/Industry Watch
The Dow Jones U.S. Medical Equipment Index ($DJUSAM) ran into overhead resistance yesterday and promptly reversed. It's been a strong group and bullish momentum is accelerating so I'd only look for a brief pause. One of the best stocks in the space is Intuitive Surgical (ISRG), which has consistently been outperforming its medical equipment peers. A short-term pullback in the group could set up a nice opportunity here:
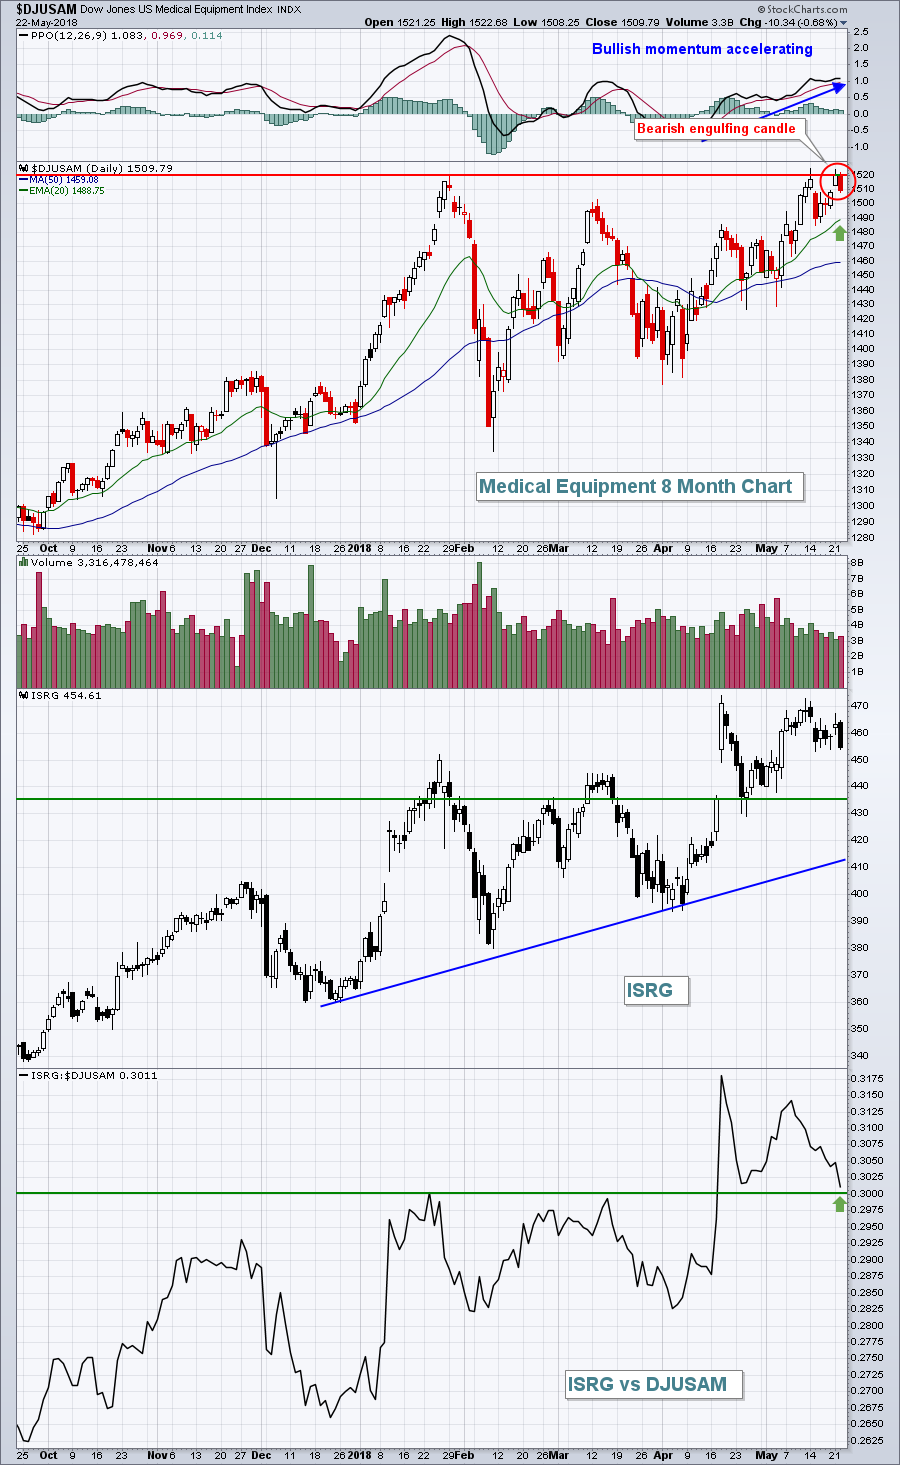 As I point out below in the Historical Tendencies section, we are about to enter the best seasonal period of the year for ISRG. Therefore a further pullback to close out May could provide a solid reward to risk entry into a great summertime performer.
Historical Tendencies
June and July have been the best two calendar months of the year for Intuitive Surgical (ISRG) over the past two decades. ISRG has averaged gaining 7.4% and 11.8% during June and July, respectively, over the past two decades. That's close to a 20% return, on average, over a 60 day period - something to consider as ISRG broke out in mid-April after a stellar quarterly earnings report.
Key Earnings Reports
(actual vs. estimate):
CM: 2.32 vs 2.21
LOW: 1.19 vs 1.22
TGT: 1.32 vs 1.38
TIF: 1.14 vs .84
(reports after close, estimate provided):
NTAP: 1.01
Key Economic Reports
May PMI composite flash to be released at 9:45am EST: 54.8 (estimate)
April new home sales to be released at 10:00am EST: 677,000 (estimate)
FOMC minutes to be released at 2:00pm EST
Happy trading!
Tom


