Market Recap for Friday, June 15, 2018
We finished Friday's action with lower major indices, primarily the result of a very weak energy sector (XLE, -2.15%). Unfortunately, that masked one of the best absolute and relative performance days in consumer staples (XLP, +1.28%) since the January high. Technically, the XLP looks the best it's looked since January. We're seeing strengthening price momentum, the recapture of prior price support lost, and on Friday the XLP enjoyed a "golden cross". Check out the chart:
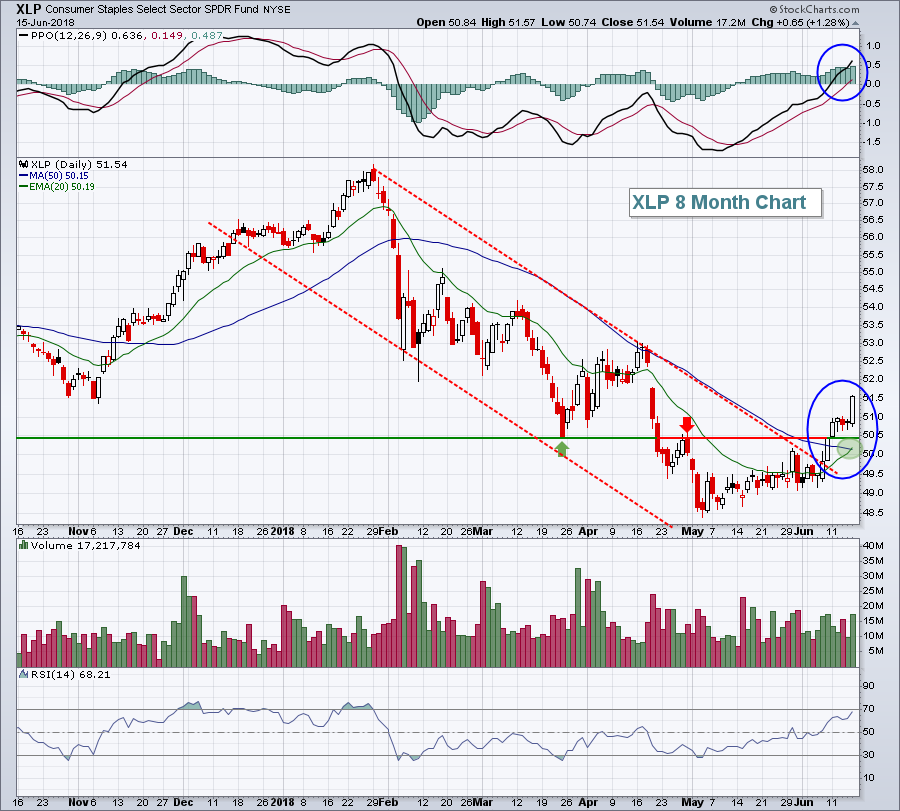 The blue circles highlight the downtrend breakout and the accelerating bullish price momentumon on the PPO. This strength has resulted in the golden cross (green shaded area) as the short-term 20 day EMA has risen back above the longer-term 50 day SMA for the first time since the early-2018 weakness began.
The two strongest industry groups within consumer staples have been food retailers & wholesalers ($DJUSFD) and distillers & vintners ($DJUSVN). Surprisingly, these two industry groups lagged its consumer staples counterparts on Friday. Instead, leadership came from brewers ($DJUSDB, +1.75%), nondurable household products ($DJUSHN, +1.66%) and soft drinks ($DJUSSD, +1.64%). Pepsi (PEP) led a rally in that latter industry group:
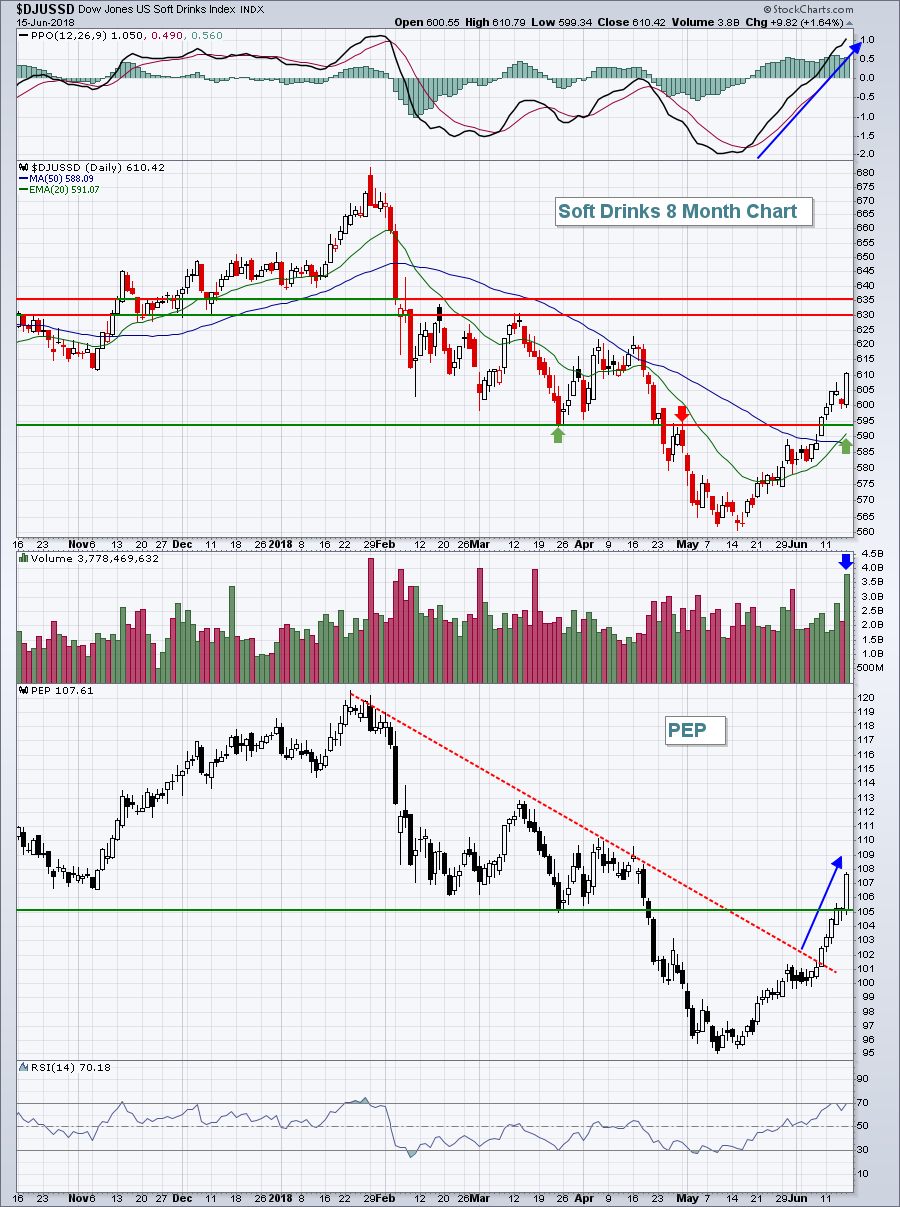 The DJUSSD now looks like an uptrending group - so long as the rising 20 day EMA provides support on pullbacks. I'd look for another 3-4% rise to test major overhead price resistance from 630-635.
Pre-Market Action
Dow Jones futures are very weak, down more than 200 points as we approach the start of a new trading week. The trade war is back in the news, but with the Volatility Index ($VIX) closing beneath 12 on Friday, I'll be surprised if selling escalates this week. I'm much more interested in how the NASDAQ and Russell 2000 perform and whether the dollar breaks out above 95 (see Current Outlook section below). The 20 day EMAs should provide excellent support and they're found at the following levels:
NASDAQ: 7575 (roughly 2.00-2.25% below current price)
Russell 2000: 1654 (nearly 2% below current price)
Gold ($GOLD) is up fractionally this morning after a HUGE selloff on Friday. This is a broken commodity and it remains out of favor. I've been avoiding it for 7 years and I see nothing to change my view. I expect to see a strengthening dollar and little inflation. That's a bad combo for gold.
Crude oil ($WTIC) was down earlier just above $64 per barrel, key price support. It's since bounced. Watch to see if support holds. If so, then we should see the XLE stabilize after much weakness on Friday.
There's a lot of global weakness in equities as trade fears permeate. The German DAX and the S&P 500 tend to move together, so it makes sense to keep an eye on the DAX today to see if it begins to reverse. If so, there's a better chance of an S&P 500 reversal as well.
Current Outlook
The U.S. Dollar Index ($USD) continues to be one of the biggest stories of 2018 as renewed strength has sent the small cap Russell 2000 soaring relative to the benchmark S&P 500. There's a big picture technical development worth watching in the USD:
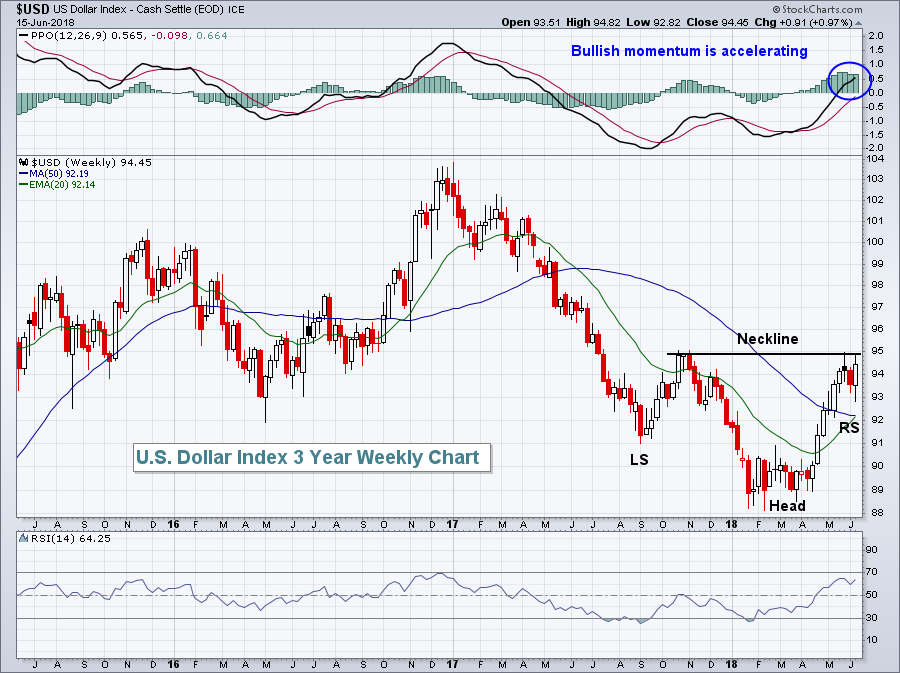 The trading range is 92-95. The rising 20 day EMA is currently at 92.14 and should provide support to the downside. In the meantime, 95 represents key neckline resistance in a bottoming reverse head & shoulders pattern. A break above 95 would signal much further dollar strength ahead, fueling the current relative strength in domestic or small cap companies.
Sector/Industry Watch
Energy (XLE, -2.15%) had a rough day on Friday and is nearing a couple key support levels:
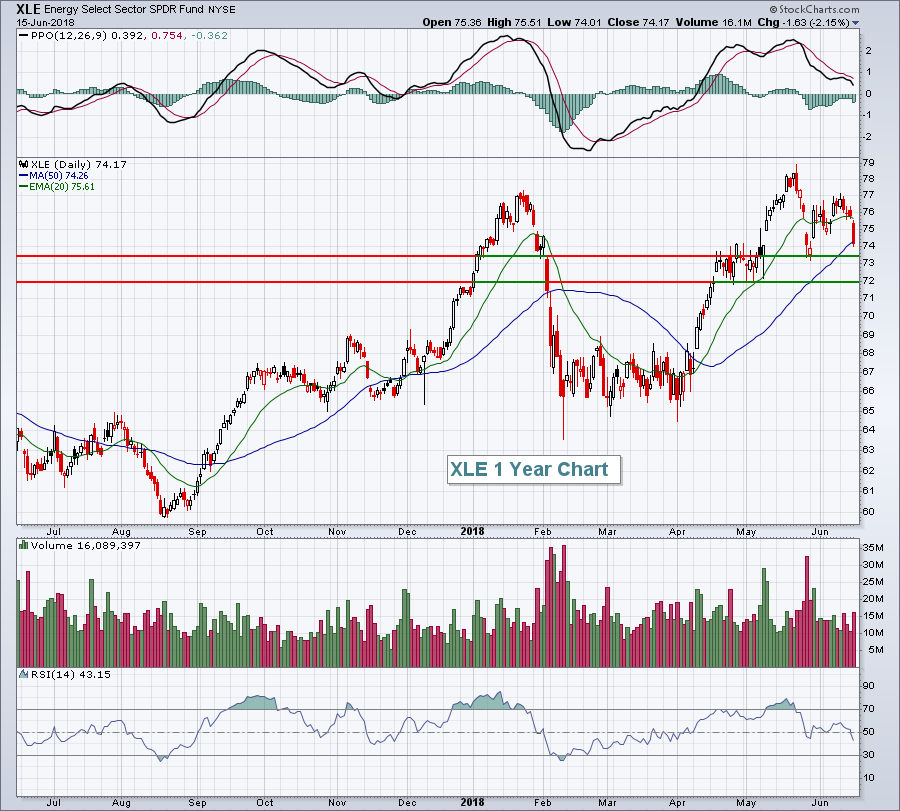 The late May low is the initial support level to watch. Should that fail to hold, then gap support and the multiple price lows near 72 is the next stop. Failure to hold 72 would become a much bigger deal technically, possibly leading to a major intermediate-term support test in the 65-66 range.
Monday Setups
The Dow Jones U.S. Banks Index ($DJUSBK) has really struggled, but much of the weakness has centered upon the large money center banks like Bank of America (BAC) and Citigroup (C), which approached five month lows on Friday as the 10 year treasury yield ($TNX) continued to falter. Regional banks, however, have performed much better on a relative basis so pullbacks in this area look rather enticing. Accordingly, my setup for this week is Zions Bancorp (ZION), which printed a hammer on Friday after testing a key support zone from 54 to 55:
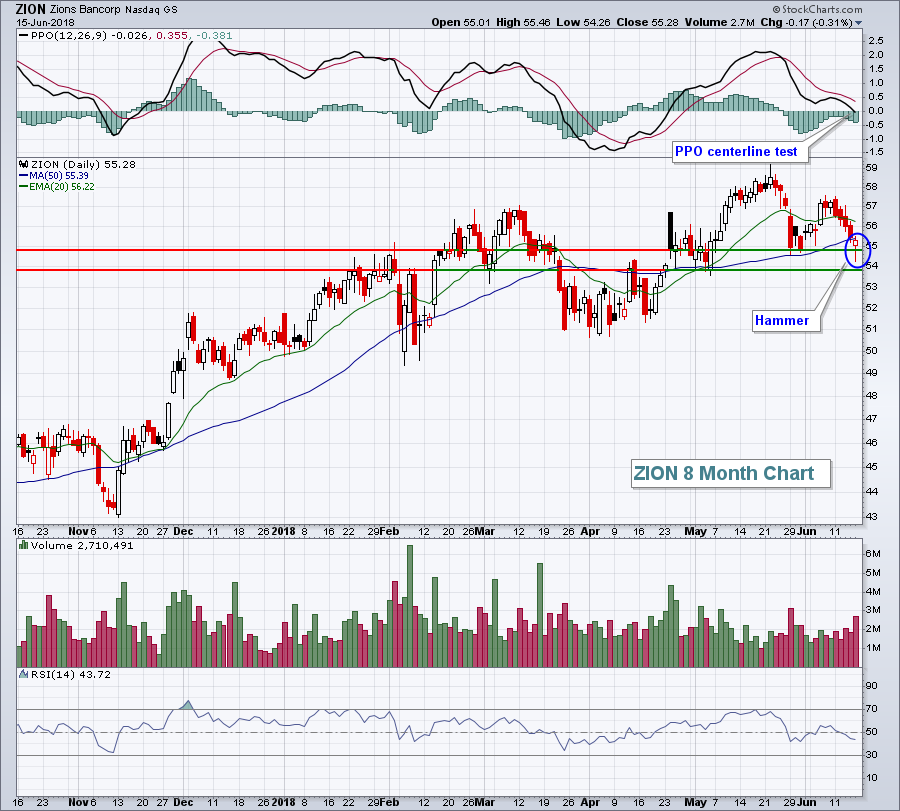 While my longer-term support at 50 would represent a much bigger problem if lost, I'd still be wary of a close beneath the 53.75 level in the short-term. I don't expect the TNX to be down for long, though, so I'd look for a recovery here sooner rather than later. My target is 58-59.
Historical Tendencies
July begins a rough stretch for small cap stocks. The Russell 2000 has produced annualized losses in July (-6.24%), August (-7.50%) and September (-1.65%) since 1987. Clearly, the worst time in July is from the 17th close through the 24th close, where the Russell 2000 has produced annualized losses of 48.88%. We're still a month away from that bearish historical period, however, so let's try to enjoy the dollar-induced small cap rally for now.
Key Earnings Reports
None
Key Economic Reports
June NAHB housing market index to be released at 10:00am EST: 70 (estimate)
Happy trading!
Tom


