Market Recap for Friday, June 1, 2018
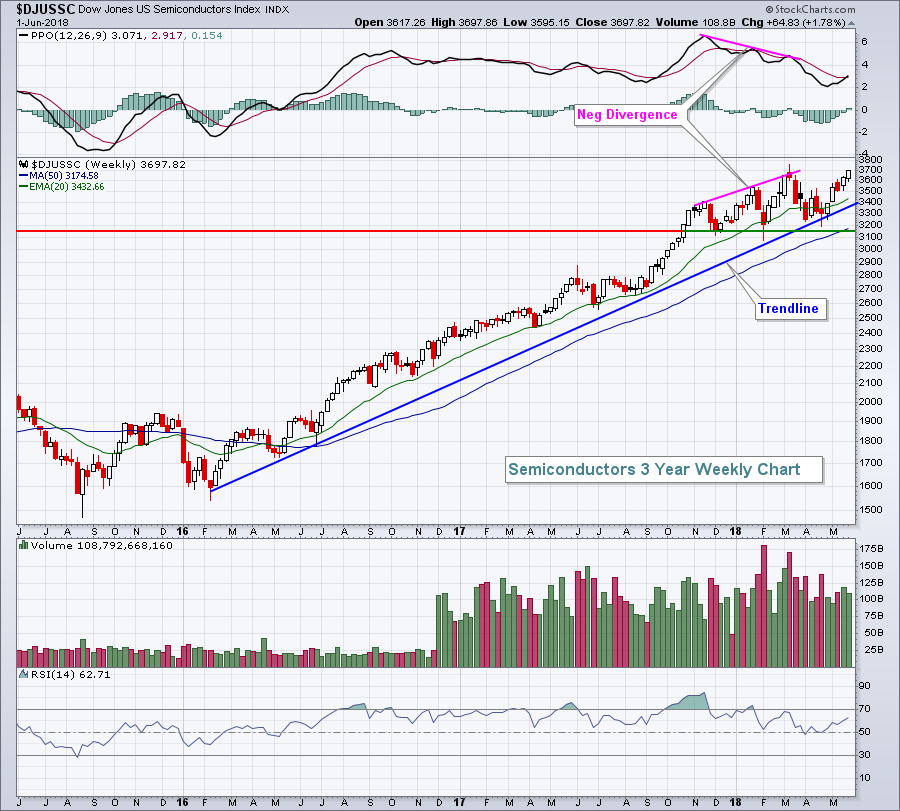
Technology (XLK, +1.70%) and materials (XLB, +1.53%) led Wall Street higher on Friday after the May nonfarm payrolls beat expectations, providing a lift for those anticipating further economic strength in the months ahead. Semiconductors ($DJUSSC, +2.42%) and internet stocks ($DJUSNS, +2.34%) powered ahead, with the former closing at its highest weekly close ever, topping August 2000's 3680 weekly close:
 Semiconductors had been struggling for a couple of reasons. First, there was that August 2000 high that had traders selling until resistance was cleared. Second, there's a negative divergence that's printed on the recent price tops. While we didn't see the 50 week SMA test, nor the PPO centerline test that we typically see after a negative divergence, the price consolidation in 2018 did lower the PPO to 2 at the end of April - its lowest PPO reading in nearly two years. The PPO is now on the move higher, evidence of accelerating price momentum. This is very bullish for technology and the U.S. stock market in general.
The 10 year treasury yield ($TNX) jumped 7 basis points on the better-than-expected jobs number and that rise in yields was the result of a significant exodus from bonds. Just one week ago, money was rotating heavily into treasuries, but that changed mid-week last week as the TNX bottomed at 2.76% and climbed back to 2.90% by Friday's close. That surge higher in the TNX sent utilities (XLU, -1.53%) to the bottom of the food chain. The XLU is still well above its February low, but much further away from its November high. The TNX soared from 2.30% in November to 2.95% in February and that caused investors to shun utilities during that stretch.
Pre-Market Action
There's little in the way of earnings or economic news out today, so both the bond market and stock market will be left to trade off technical conditions and global markets.
The 10 year treasury yield ($TNX) is up one basis point this morning, just above the 2.90% level. Gold ($GOLD) continues to meander around the $1300 per ounce area. Crude oil prices ($WTIC) are lower this morning after closing a bit beneath key short-term support at $66 per barrel. I'd like to see a reversal in crude oil today. I was stopped out of two energy stocks on Friday and lower crude oil prices will likely add to energy woes, barring a reversal.
Global equity strength is fueling a rise in U.S. futures this morning. Dow Jones futures are higher by 135 points with 30 minutes left to the opening bell.
Current Outlook
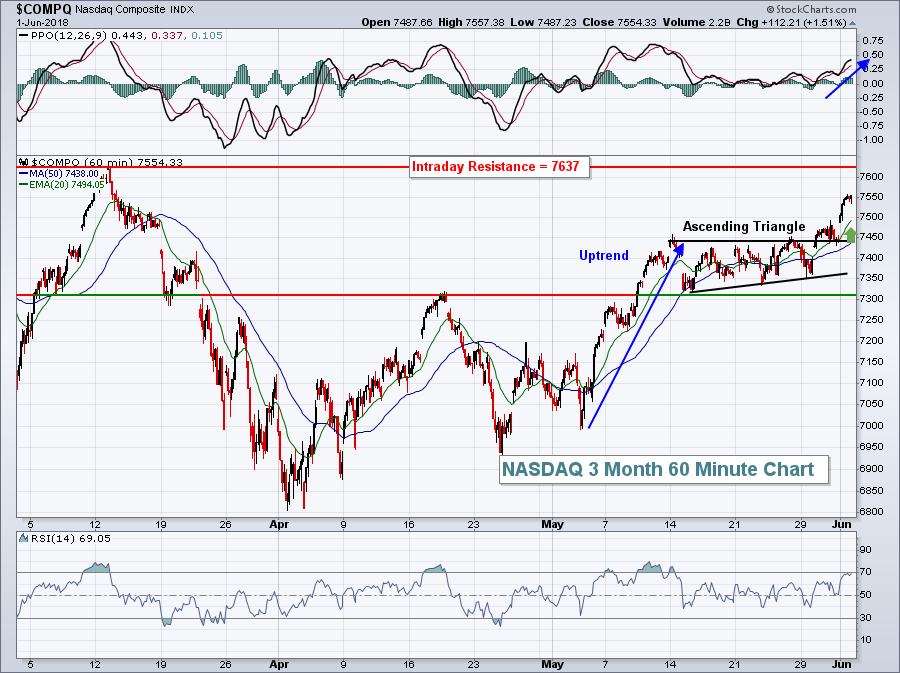
The NASDAQ is poised to run higher this week. It's only 80 points or so from its highest intraday reading ever and, if the recent ascending triangle breakout is any indication, look for this test sooner rather than later. In fact, in the very near-term, I'd look for the trading range to be 7494-7637. That represents the range between its 20 hour EMA support and that 7637 intraday price resistance:
 The NASDAQ lost 10% of its value over a three week period from mid-March to early-April, but that entire decline has just about been recovered now. Given the strength in key aggressive areas of technology, I suspect we'll see the NASDAQ break to all-time highs in the very near future.
Sector/Industry Watch
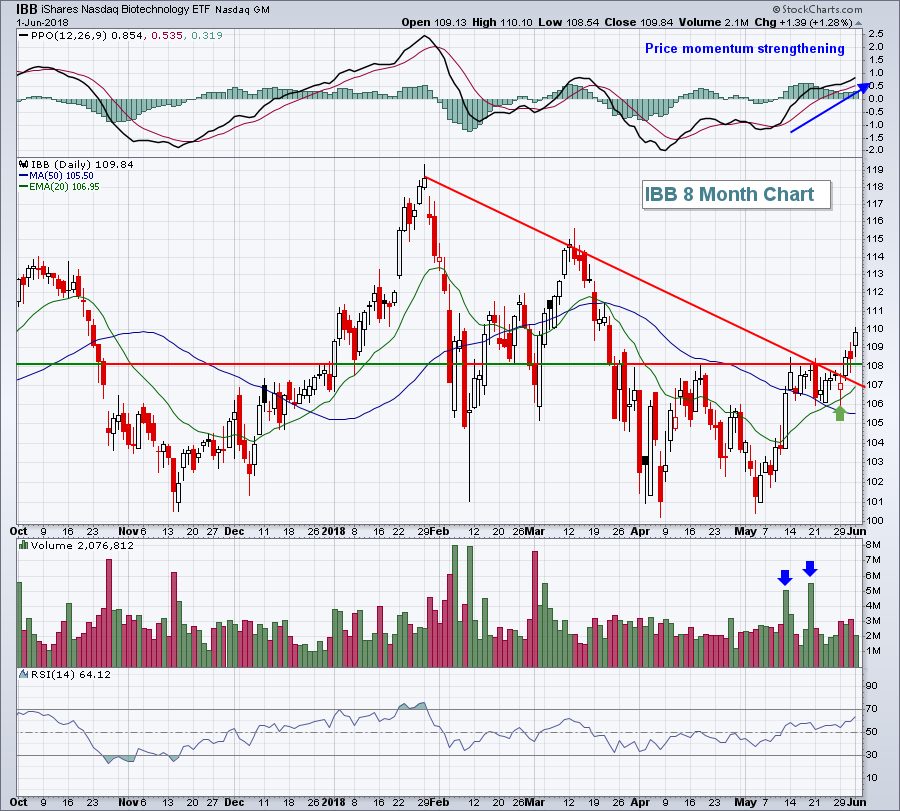
The iShares NASDAQ Biotechnology ETF (IBB) has broken its downtrend line after suggesting an uptrend was underway. Any time the PPO is above its centerline and pullbacks hold the rising 20 day EMA, I'm bullish. Breaking overhead price resistance or downtrend lines adds to this bullishness:
 The green arrow highlights the successful 20 day EMA test and the blue directional line shows that bullish price momentum is building. (Disclosure: I own shares of IBB)
Monday Setups
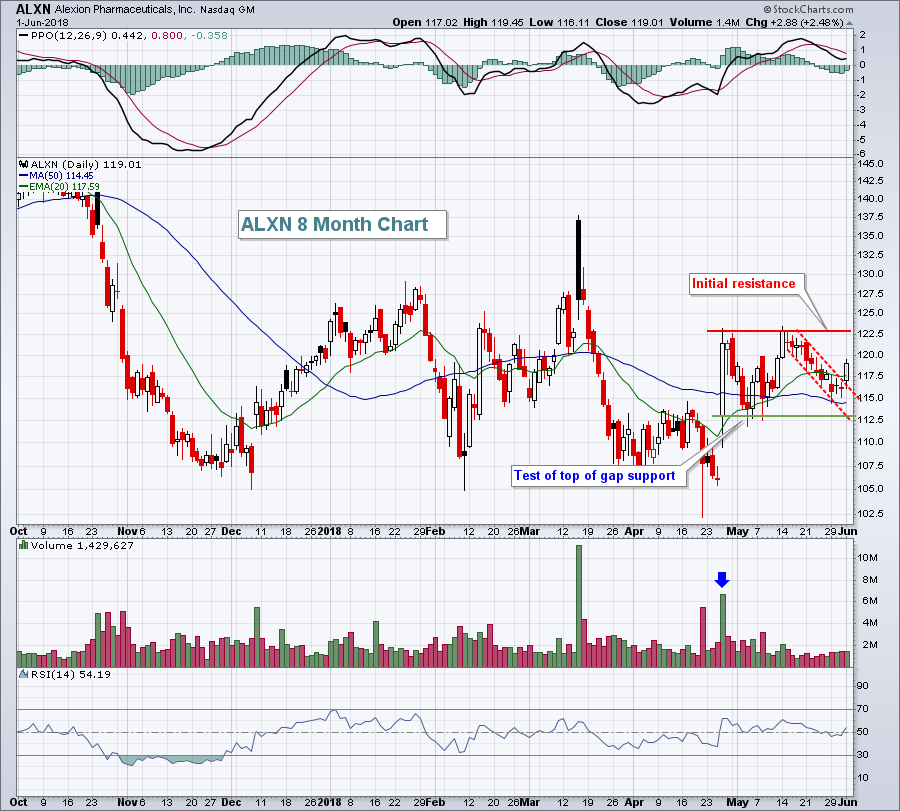
Alexion Pharmaceuticals (ALXN) is a volatile biotechnology company whose technical view appears to be strengthening. First, the biotechs overall appear poised to move higher. Second, ALXN recently reported revenues and EPS well above Wall Street expectations (EPS: 1.68 vs 1.48). Finally, after an initial earnings-related gap higher, ALXN filled back to the top of its gap support and bounced. More recently, it'd been downtrending, but that downtrend appears to have been broken on Friday:
 I'm looking for a short-term push higher to test initial price resistance near 123. A break above that level, especially on increasing volume, would suggest a potential move back to 137.50.
Historical Tendencies
The Dow Jones U.S. Aluminum Index ($DJUSAL) just lost more than 8% in the past month and now it's entered June, a seasonally weak period. In fact, the DJUSAL has performed worse in only one month - September. Given the weak technical picture and bearish seasonal outlook, this is an industry you might want to avoid currently.
Key Earnings Reports
(actual vs. estimate):
DVMT: 1.24 vs. 1.16
(reports after close, estimate provided):
PANW: .96
Key Economic Reports
April factory orders to be released at 10:00am EST: -0.4% (estimate)
Happy trading!
Tom


