Market Recap for Friday, July 13, 2018
The Dow Jones moved back above 25000 and the S&P 500 cleared 2800 for the first time since February 2nd on the backs of two unlikely heroes. Walgreens Boots Alliance (WBA), the newest member of the Dow Jones, and Walt Disney (DIS) gained 2.02% and 1.62%, respectively, to power the Dow Jones higher. The latter made a significant breakout in the process as broadcasting & entertainment ($DJUSBC) are showing signs of significant strength:
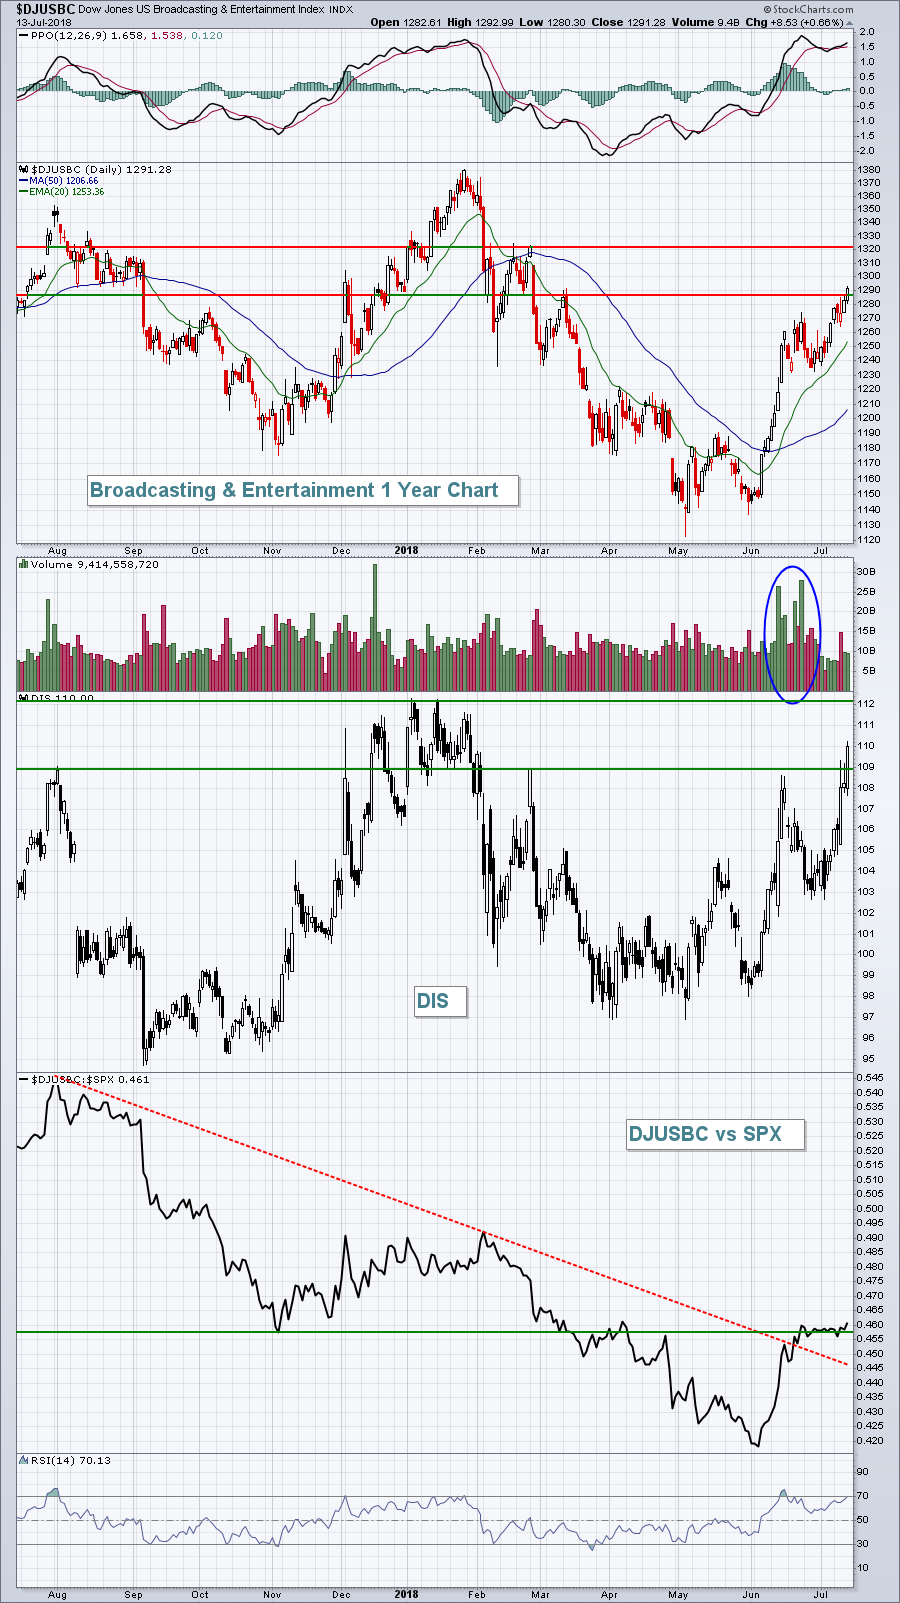 The increasing volume to accompany the DIS move higher in June is encouraging, as are the relative breakouts above both the relative downtrend line and relative price resistance.
As a result of the strength in WBA, consumer staples (XLP, +0.65%) led from a sector perspective. Energy (XLE, +0.53%) and industrials (XLI, +0.52%) also had strong relative days. Aerospace ($DJUSAS) led the industrials and is featured below in the Sector/Industry Watch section.
Earnings in key bank stocks ($DJUSBK) took center stage on Friday morning and results were mixed and price action was volatile. The key takeaway in the end, however, was that the DJUSBK held price support in the 450-455 zone after reaching 453.24 intraday.
A number of key earnings reports will be featured this week, beginning with the widely anticipated report from Netflix (NFLX) after the bell today.
Pre-Market Action
The 10 year treasury yield ($TNX) is up one basis point to 2.84% and gold ($GOLD) is flat, clinging to key price support at $1240 per ounce. The big news of the morning is crude oil, which is down 2.25% this morning, falling back beneath $70 per barrel for the first time in 3 weeks.
We're seeing mixed global markets with Asian markets mostly lower overnight, while the German DAX ($DAX) currently clings to a minor gain. With a little more than 30 minutes to the opening bell, Dow Jones futures are 16 points higher as we begin a new trading week.
Current Outlook
Negative divergences on 60 minute charts can have a significant impact on the short-term direction of equity prices. Last week, I showed how the Russell 2000 had hit an all-time high intraday, but printed a reversing candle. The RUT's 60 minute chart confirmed this potential short-term top as a negative divergence printed on that all-time high:
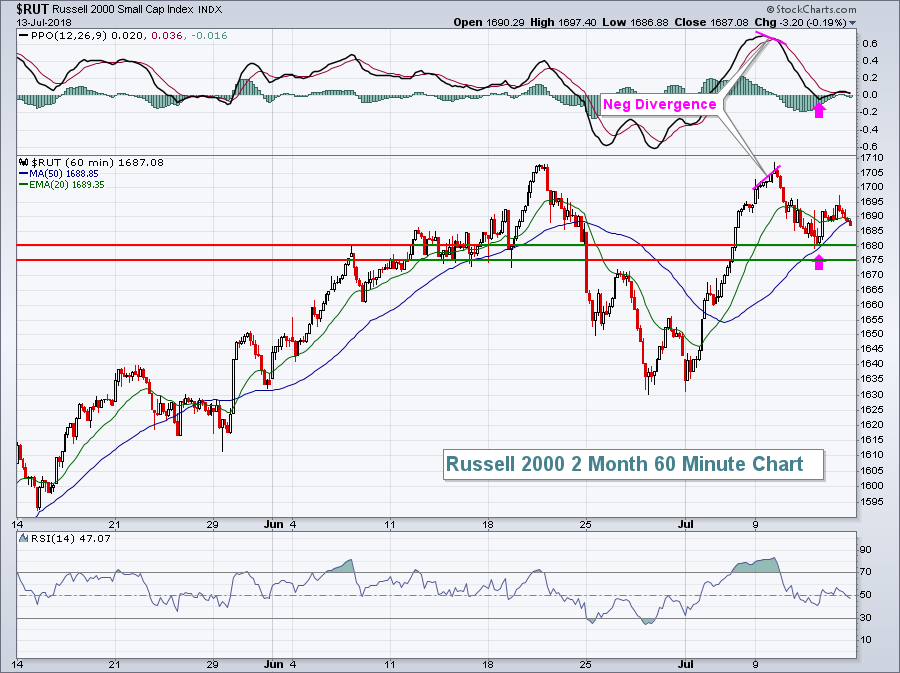 The good news is we've seen both 50 hour SMA and PPO centerline tests, so the RUT could simply break out and move higher from here. To the downside, watch the 1675-1680 support area. A close beneath this support zone could result in further short-term selling, especially since we have one of the most bearish weeks (historically) of the year approaching. The July 18th through July 24th week has produced annualized returns of -48.88% since 1987 on the Russell 2000.
Sector/Industry Watch
The Dow Jones U.S. Aerospace Index ($DJUSAS) has been a leader of the U.S. stock market for a long time, but that strength has been tested in 2018 as the group continues to consolidate in a bullish rectangular consolidation pattern:
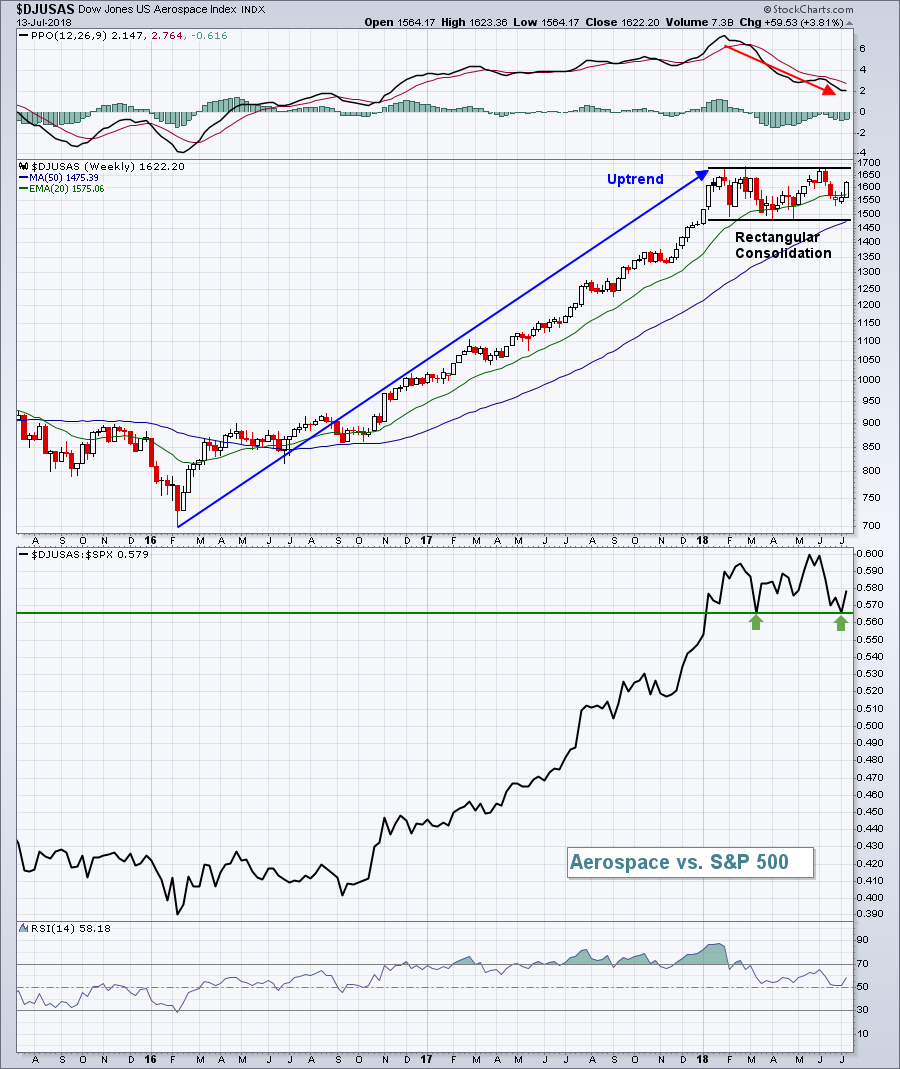 Further consolidation is certainly a possibility given the level of relative outperformance over the past 2 1/2 years. But make no mistake about it, aerospace has been a leader of this bull market and its bullish pattern should be respected.
Monday Setups
Wright Medical Group (WMGI) broke its downtrend and began strengthening significantly on both an absolute and relative basis in early May. Volume accompanied this relative strength and indicates accumulation. Over the past few weeks, however, WMGI has pulled back and that creates opportunity in my view:
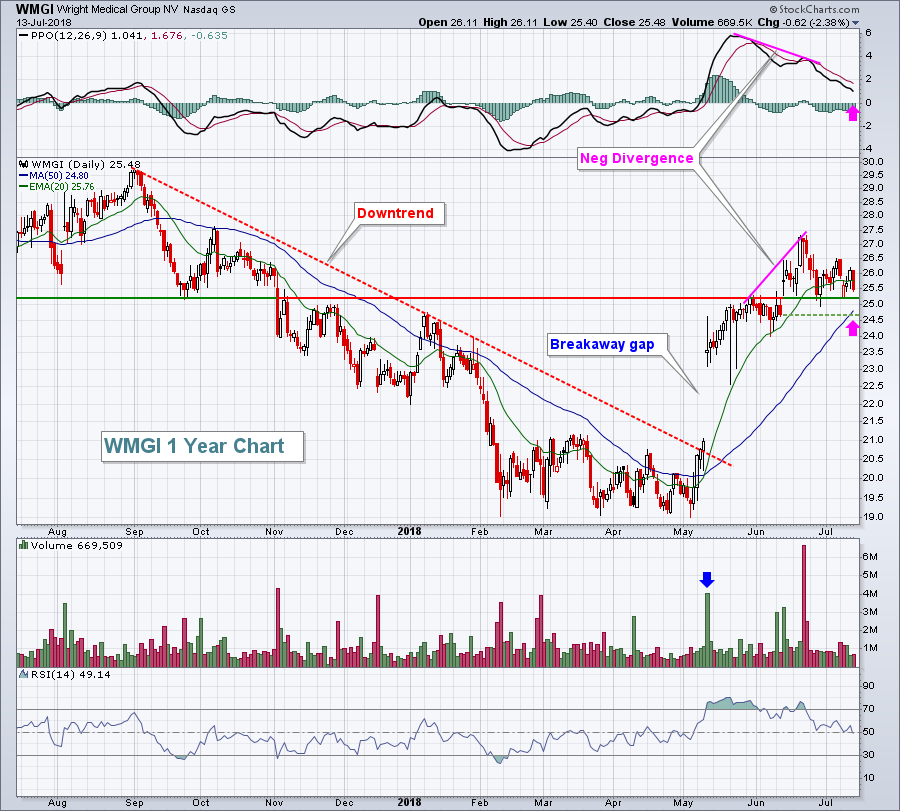 I look for 50 day SMA and PPO centerline tests to unwind overbought conditions and to "reset" the PPO. We're on the verge of doing both so I'd be looking for strength to resume soon with fresh highs in the foreseeable future. My target would be 29.50. Consider entry at the current price and again at 24.75 with a closing stop beneath 24.00.
Historical Tendencies
Since 1950, the S&P 500 has significantly outperformed during the first half of calendar months vs. the second half. Here are the annualized returns:
1st through 15th: +11.72%
16th through 31st: +5.87%
Key Earnings Reports
(actual vs. estimate):
BAC: .63 vs .57
BLK: 6.66 vs 6.60
JBHT: 1.37 vs 1.28
(reports after close, estimate provided):
NFLX: .79
Key Economic Reports
June retail sales released at 8:30am EST: +0.5% (actual) vs. +0.5% (estimate)
June retail sales less autos released at 8:30am EST: +0.4% (actual) vs. +0.4% (estimate)
July empire state manufacturing survey released at 8:30am EST: 22.6 (actual) vs. 21.0 (estimate)
May business inventories to be released at 10:00am EST: +0.4% (estimate)
Happy trading!
Tom
