Market Recap for Tuesday, July 24, 2018
Earnings are dominating the headlines and the action on Wall Street. The Dow Jones and S&P 500 had been underperforming its NASDAQ and Russell 2000 counterparts throughout much of the second quarter. As a result, their positive earnings surprises seem to be garnering much more positive attention than what we've seen on the NASDAQ. For instance, last Thursday after the bell, Microsoft (MSFT) delivered a solid quarterly report and saw initial strength at Friday's open. But then the sellers took over. Yesterday, Alphabet (GOOGL) reported blowout results, but wasn't able to follow through on a gap higher at the open. As Yogi Berra would say, "it was deja vu all over again".
Meanwhile, several Dow Jones component stocks have reported excellent results and have seen much stronger responses - not only at the opening bell, but also throughout the trading session. United Technologies (UTX) was the latest example of this, posting revenues ($16.71 bil vs $16.26 bil) and EPS ($1.97 vs $1.85) well above consensus estimates. Instead of gapping higher and fizzling, UTX actually gapped slightly lower, then soared on buying throughout the session:
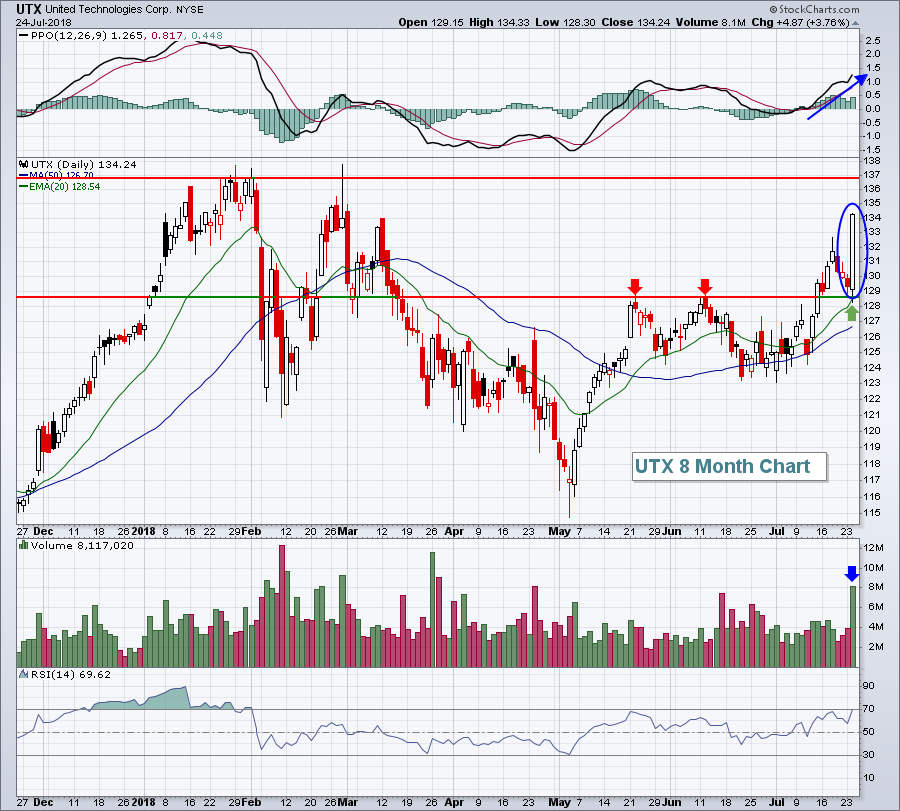 Keep in mind that, in the case of MSFT and GOOGL, RSIs were already very overbought. These stocks had priced in blowout quarters. UTX had begun to trade better technically in recent weeks, but was nowhere near the overbought levels of MSFT and GOOGL. Short-term rotation benefited UTX and the Dow Jones stocks. As a result, the Dow Jones was able to post a solid 198 point gain on Tuesday, while the NASDAQ finished slightly in negative territory. The small cap Russell 2000 was punished, falling more than 1%. The Russell 2000 actually touched its all-time high close early in the session before technical selling kicked in:
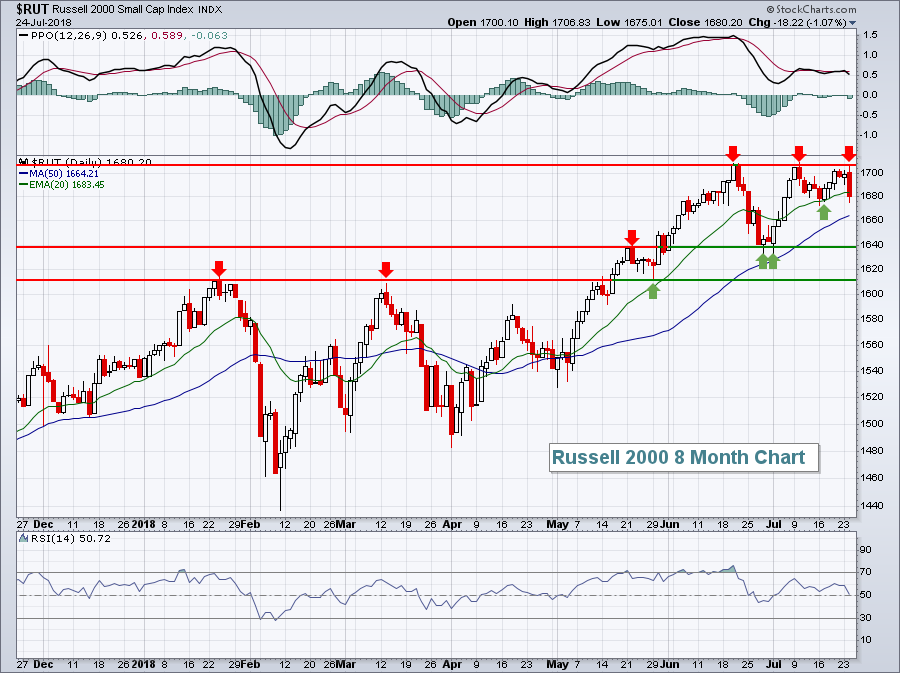 The red arrows mark key short-term price resistance, while the green arrows mark short-term price support. We're currently testing the lows from a week or so ago just beneath 1680. If this support fails to hold, 1640 would be next key price support.
Materials (XLB, +1.29%) and energy (XLE, +1.26%) were the sector leaders on Tuesday, while consumer stocks lagged. Consumer discretionary (XLY, -0.29%) was the only sector to finish in negative territory. The selling in home construction ($DJUSHB, -2.89%) proved costly to discretionary stocks. The DJUSHB is reviewed in more detail in the Sector/Industry Watch section below.
Pre-Market Action
Gold ($GOLD) is up $6 per ounce and is looking to challenge overhead price resistance near $1240 per ounce. Crude oil ($WTIC) is relatively flat, as is the 10 year treasury yield ($TNX). Overnight, Asian markets were mostly higher, but Europe is weak.
With a ton of earnings expected over the next 2-3 weeks, U.S. markets are looking for direction. With 30 minutes left before today's opening bell, the Dow Jones is set to drop 100 points, primarily from weakness in Boeing (BA), which beat earnings estimates, but disappointed investors with its guidance.
Current Outlook
The Russell 2000 has two items on its wish list. First and foremost, the Russell 2000 needs to clear price resistance near 1707 and set a fresh new all-time high. Second, small caps benefit from a rising dollar and the U.S. Dollar Index ($USD) is struggling to break neckline resistance:
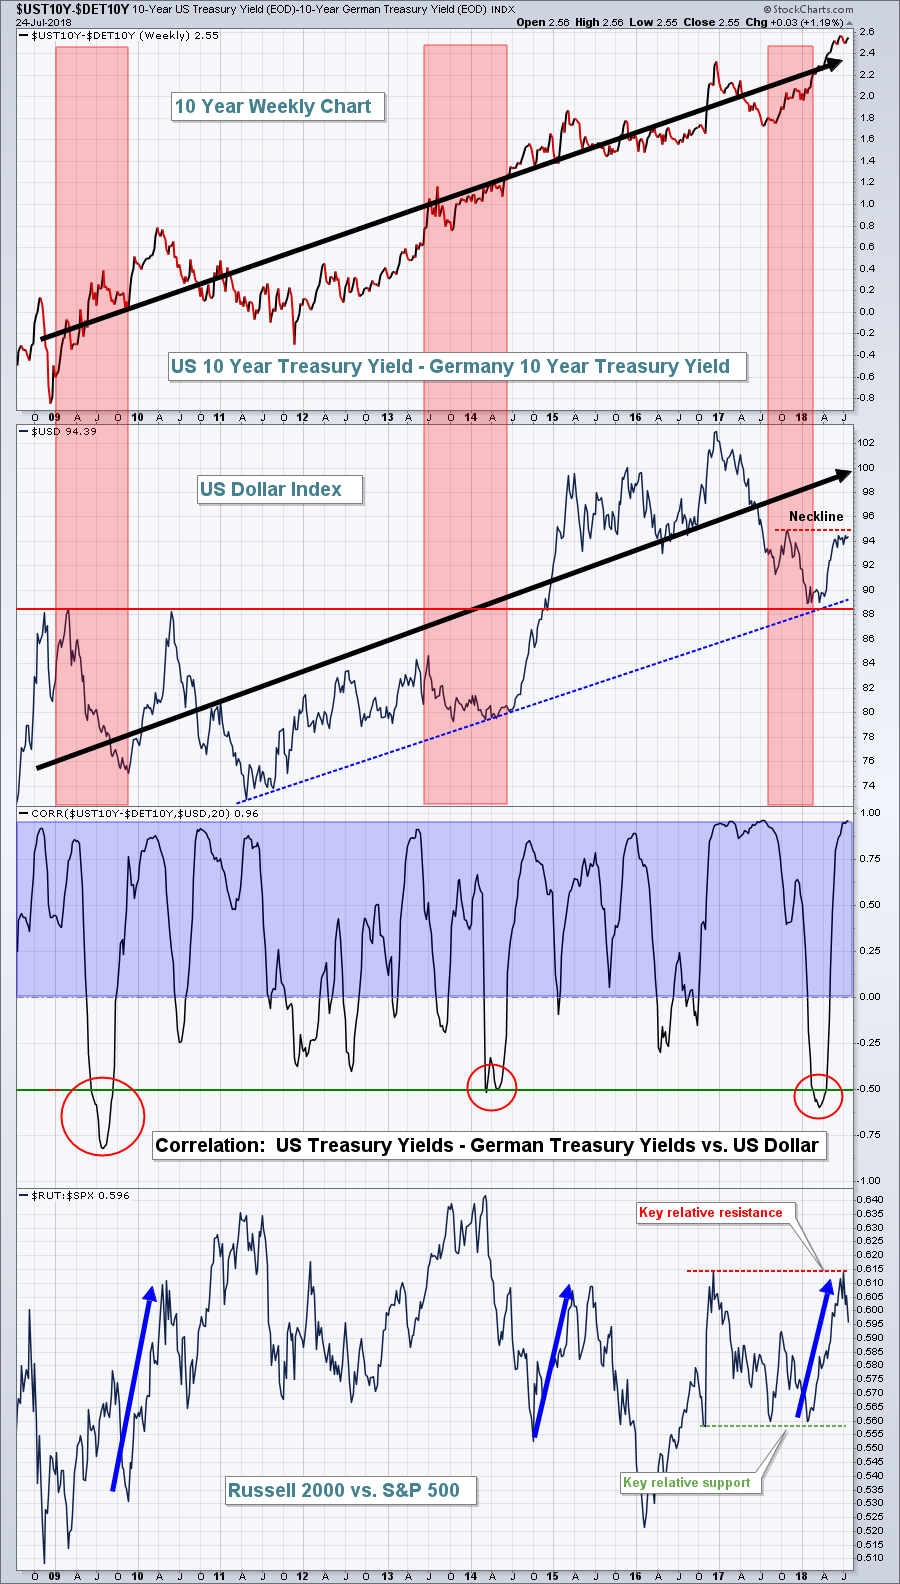 The reason that I remain bullish the dollar is quite simple. Historically, the dollar follows the direction of 10 year U.S. Treasury Yield ($UST10Y) minus the 10 year German Treasury Yield ($DET10Y) and that US vs German treasury yield relationship continues to push higher. That is likely to result in a much higher dollar and, if that occurs, this relative rise in small caps isn't over. The key here will be the dollar. If the USD breaks 95 neckline resistance, then I expect small caps to dominate large caps in the second half of the year.
Sector/Industry Watch
This morning, we'll get the latest on new home sales. While I'm interested in the latest news, I'm much more interested in the current technical state of home construction ($DJUSHB).....and it's not pretty. I still believe in this group, but after a meteoric rise in 2017 and the top in January 2018, the DJUSHB has further room to fall. The declining weekly PPO and continuing failure at the declining 20 week EMA does not bode well for this industry, but I see hope at 725 price support:
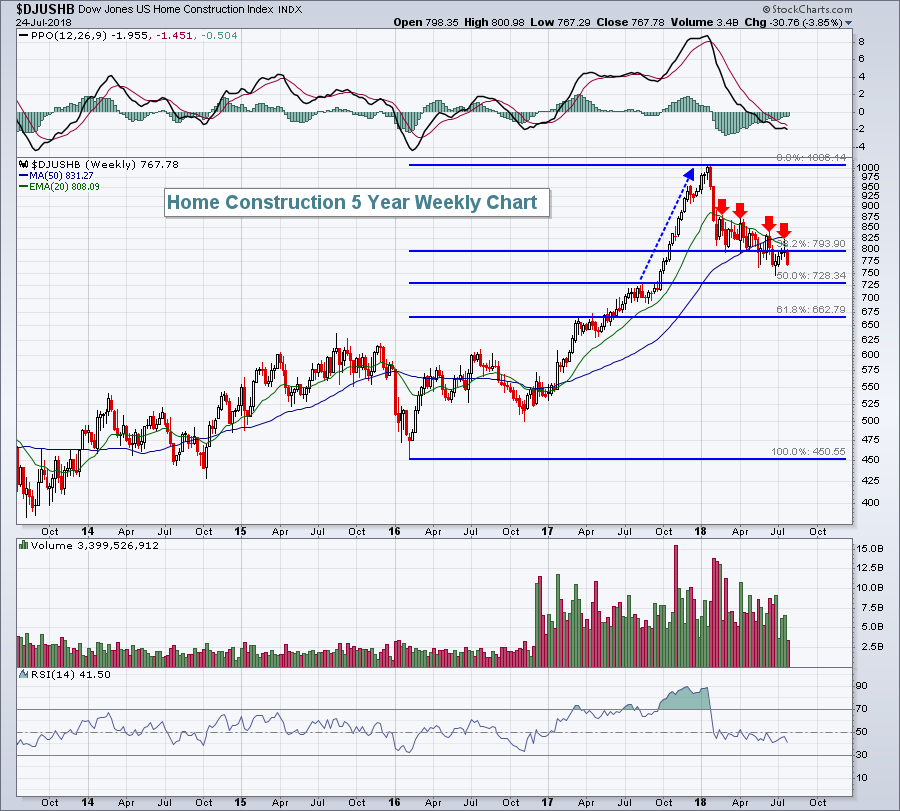 The DJUSHB set a top in August 2017 near 725, consolidated a bit, then surged in the 4th quarter. That last breakout could serve as key support during this bout of selling. Watch for a positive divergence to set up as that price level is tested. Also, note that the 50% Fibonacci retracement level is at 728, another reason to look for a possible reversal at or near that level.
Historical Tendencies
After stellar outperformance, the small cap Russell 2000 has badly lagged the benchmark S&P 500 over the past month. Technically, I look for small caps to outperform again soon as I believe the U.S. Dollar Index ($USD) will break above 95 resistance. A rising dollar is bad for multinational companies as their foreign earnings are compromised by a higher dollar. That, in turn, typically leads to money rotating into domestic, or small cap, companies.
The mid-July to late September period, however, can be problematic for all stocks. The Russell 2000 is currently struggling as bearish historical tendencies from July 18th through August 10th seem to be taking over. Over the past three decades, this three week period has produced annualized returns of -27.74%.
Key Earnings Reports
(actual vs. estimate):
AEP: 1.01 vs .88
ANTM: 4.25 vs 4.19
APH: .90 vs .85
BA: 3.33 vs 3.24
BSX: .41 vs .34
CHKP: 1.37 vs 1.31
FCAU: .99 (estimate - awaiting results)
FCX: .58 vs .54
GD: 2.82 vs 2.49
GLW: .38 vs .37
GM: 1.81 vs 1.86
HCA: 2.14 (estimate - awaiting results)
HLT: .70 vs .70
IR: 1.85 vs 1.72
KO: .61 vs .60
NEE: 2.11 vs 2.07
NOC: 3.93 vs 3.83
NSC: 2.50 vs 2.31
ROK: 2.16 vs 2.03
SIRI: .06 vs .06
STM: .29 vs .30
TEL: 1.43 vs 1.37
TMO: 2.75 vs 2.63
TROW: 1.77 vs 1.81
UPS: 1.94 vs 1.92
WM: 1.01 vs 1.01
(reports after close, estimate provided):
ALGN: 1.09
F: .34
FB: 1.75
GILD: 1.55
LVS: .80
MDLZ: .54
NOW: .43
ORLY: 4.04
PYPL: .56
QCOM: .71
SU: .57
V: 1.08
VRTX: .72
Key Economic Reports
June new home sales to be released at 10:00am EST: 668,000 (estimate)
Happy trading!
Tom


