Market Recap for Tuesday, July 10, 2018
The good news from yesterday is that the Russell 2000 hit an intraday all-time high at 1708.56, edging out intraday highs from June 20th and 21st. The bad news? Sellers took over from there. The record took place in the opening minutes on Tuesday, then the reversal took place. Here's a 10 day, 10 minute chart that shows the slide in small caps after the opening bell:
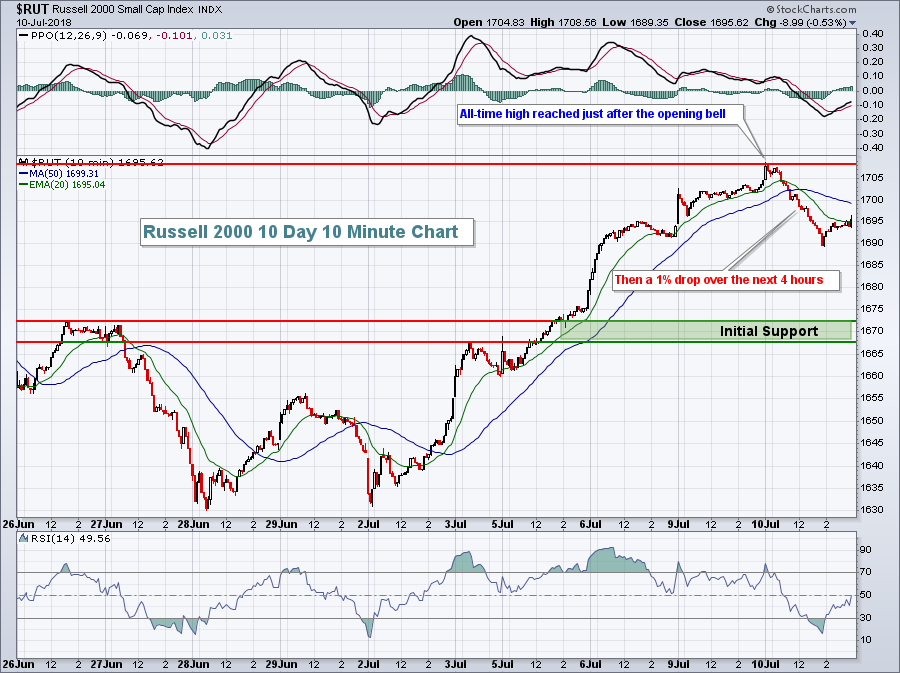 This is noteworthy because the small cap Russell 2000 has been the leading index in 2018, along with the NASDAQ. Hitting a key high and reversing often times sets a short-term top.
Eight of nine sectors advanced on Tuesday, with defensive sectors leading. Consumer staples (XLP, +1.19%) and utilities (XLU, +0.95%) were the top gainers, while financials (XLF, -0.37%) failed to participate. Pepsi (PEP) reported better-than-expected earnings to lift a strong soft drinks industry ($DJUSSD, +2.91%) and Proctor & Gamble (PG) was the strongest Dow Jones component. Both were leaders of that strong consumer staples space. The XLP continues to perform well technically:
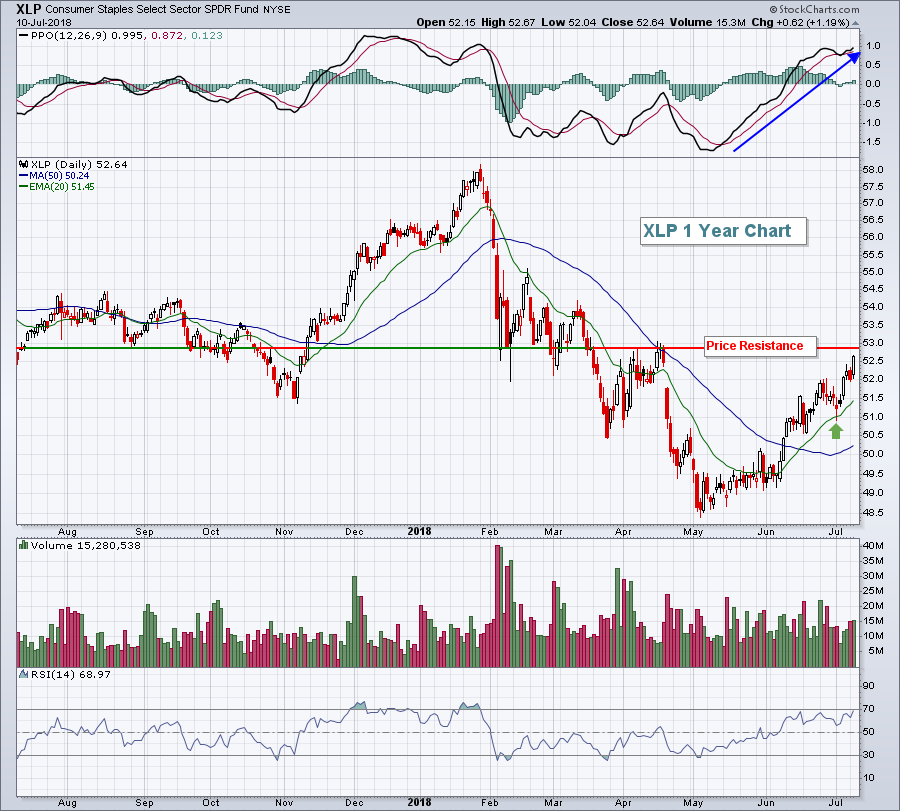 A rising PPO and successful tests of a rising 20 period EMA during pullbacks is exactly what I want to see in an uptrending stock, index or ETF. So all is good right now. But there is overhead price resistance approaching and I'd be surprised to see the XLP move through it without at least a temporary bout of selling.
Pre-Market Action
Crude oil ($WTIC) is down approximately 1% this morning, while the 10 year treasury yield ($TNX) is relatively flat.
Asian markets again tumbled after the U.S. announced a new round of tariffs totaling $200 billion. It's not helping U.S. futures either as that headline takes its toll. Most European indices are down close to 1% and Dow futures are lower by 173 points with a bit more than 30 minutes left to the opening bell.
The selling in the U.S. comes at an opportune time on the charts as the S&P 500 managed to barely close at its highest level since the late January decline began. The S&P 500 never made the reaction high on an intraday basis, so the bears are likely to feel rather confident in a near-term drop from current prices.
Current Outlook
While I pointed out the potential near-term top in the Russell 2000 in the Market Recap section above, I remain very bullish small caps. In fact, it appears that the Russell 2000 simply finished the right side of its cup. A cup with handle is a bullish continuation pattern, so I'll look to rebuy the IWM (ETF that tracks the Russell 2000) on a pullback to test the rising 20 day EMA. Here's a look at that bullish daily chart:
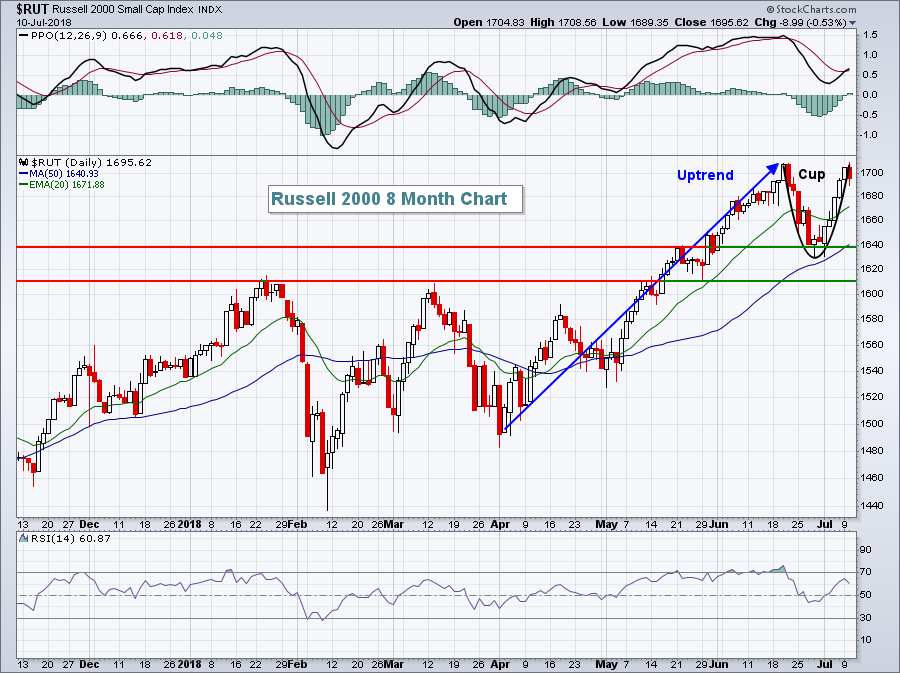 Notice that the 20 day EMA currently resides at 1672, which coincides with the initial support illustrated earlier in that 10 day, 10 minute chart. It wouldn't be a horrible thing if the 20 day EMA fails to hold, however, as rectangular consolidation could form on the daily chart by retesting the low at the end of June. Also, the double top breakout at 1610 would provide excellent support from a more intermediate-term outlook on deeper selling, should that develop.
Sector/Industry Watch
The three transportation industry groups - railroads ($DJUSRR), airlines ($DJUSAR) and truckers ($DJUSTK) - were the three worst performing groups within the industrials sector (XLI). The most notable, however, was the DJUSTK's reversal after attempting to climb back above its 20 day EMA. That has a particularly strong bearish feel to it in the short-term:
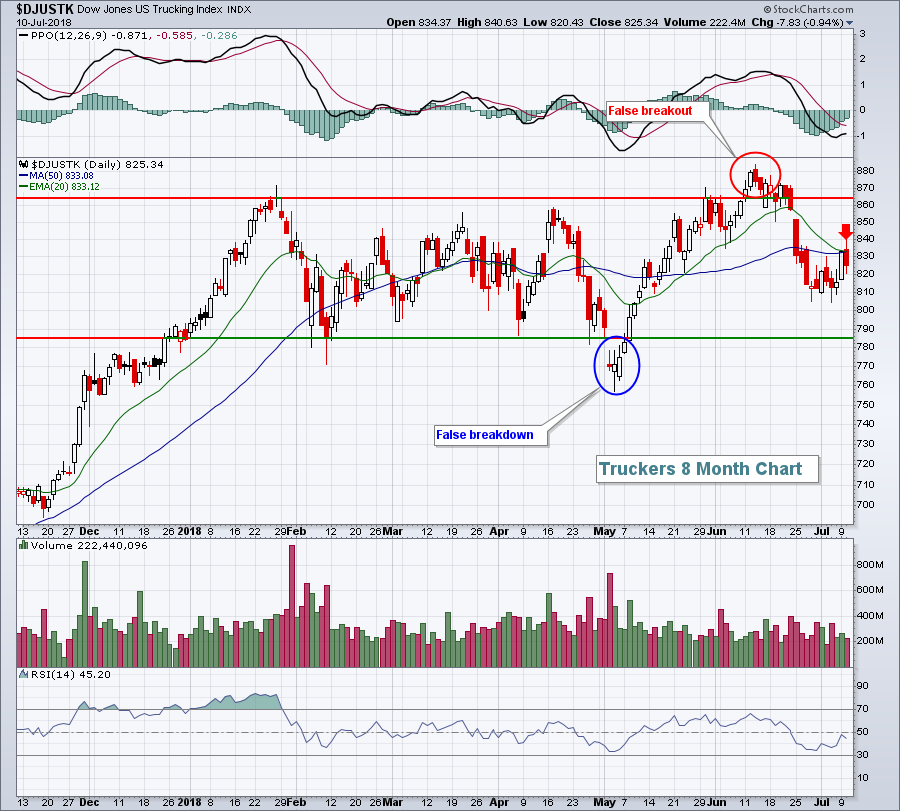 The failure at the 20 day EMA is likely to embolden the bears, especially with futures pointing to a lower open today. I believe we'll see truckers rebound, but not before another test of support near 785.
Historical Tendencies
The NASDAQ 100's top July performers historically are at it again. Here are their July month-to-date returns, followed by their average July returns over the past two decades in parenthesis:
Intuitive Surgical (ISRG): +4.94% (+11.8%)
Baidu (BIDU): +7.51% (+11.3%)
Amgen (AMGN): +6.01% (+9.8%)
Cognizant Technology (CTSH): +3.49% (+6.8%)
Key Earnings Reports
(actual vs. estimate):
FAST: .74 vs .66
(reports after close, estimate provided):
OZRK: .89
Key Economic Reports
June PPI released at 8:30am EST: +0.3% (actual) vs. +0.2% (estimate)
June Core PPI released at 8:30am EST: +0.3% (actual) vs. +0.3% (estimate)
May wholesale inventories to be released at 10:00am EST: +0.5% (estimate)
Happy trading!
Tom


