Market Recap for Monday, July 30, 2018
Only three sectors were able to finish in positive territory on Monday as bears permeated Wall Street. Two of the three - financials (XLF, +0.07%) and healthcare (XLV, +0.06%) - barely managed to eke out gains. The only real strength was found in energy (XLE, +0.82%) as crude oil prices ($WTIC) closed above $70 per barrel for the first time in two weeks. Leading energy higher were exploration & production stocks ($DJUSOS), which are highlighted below in the Sector/Industry Watch section.
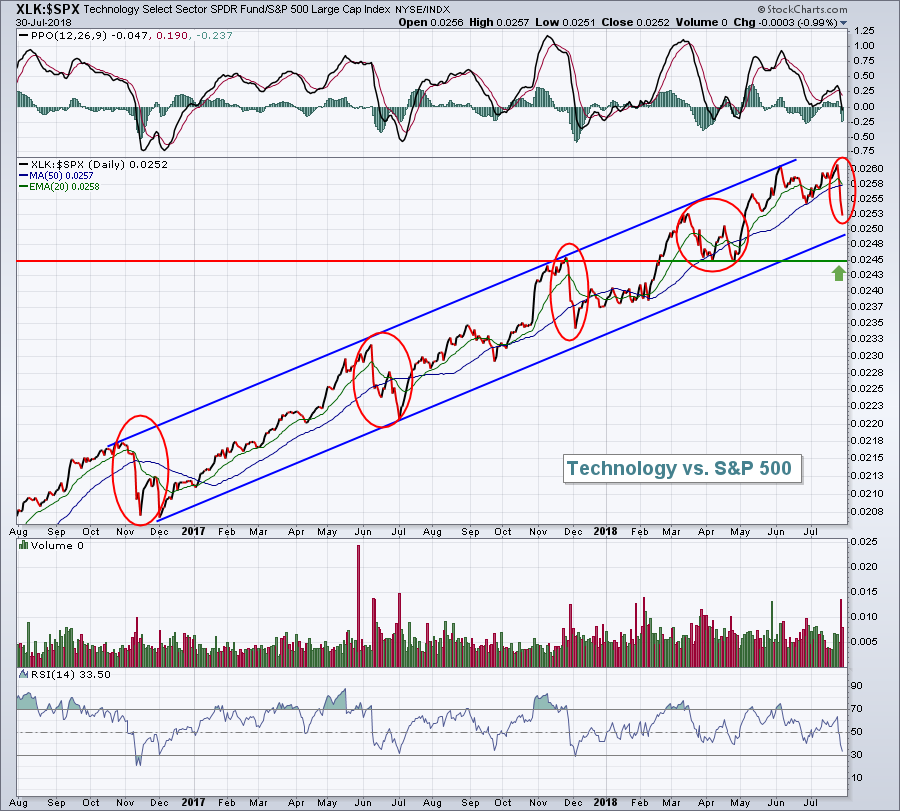
For a third consecutive day, technology (XLK, -1.56%) dominated the selling. Any time we see selling in the FAANG stocks, or technology in general, market pundits scream "The Sky is FALLING!" It's happened before folks. Ummmm, like four previous times over the past two years:
 Money rotates into and out of all sectors from time to time. Yes, even technology. We remain in a clear relative channel and as long as this continues, use relative weakness in technology to accumulate. I'd grow much more cautious if the above .0245 relative support level is broken. That would clearly be a break of channel support AND relative price support and would be an indication of more serious distribution in a leading group. For now, buy the weakness.
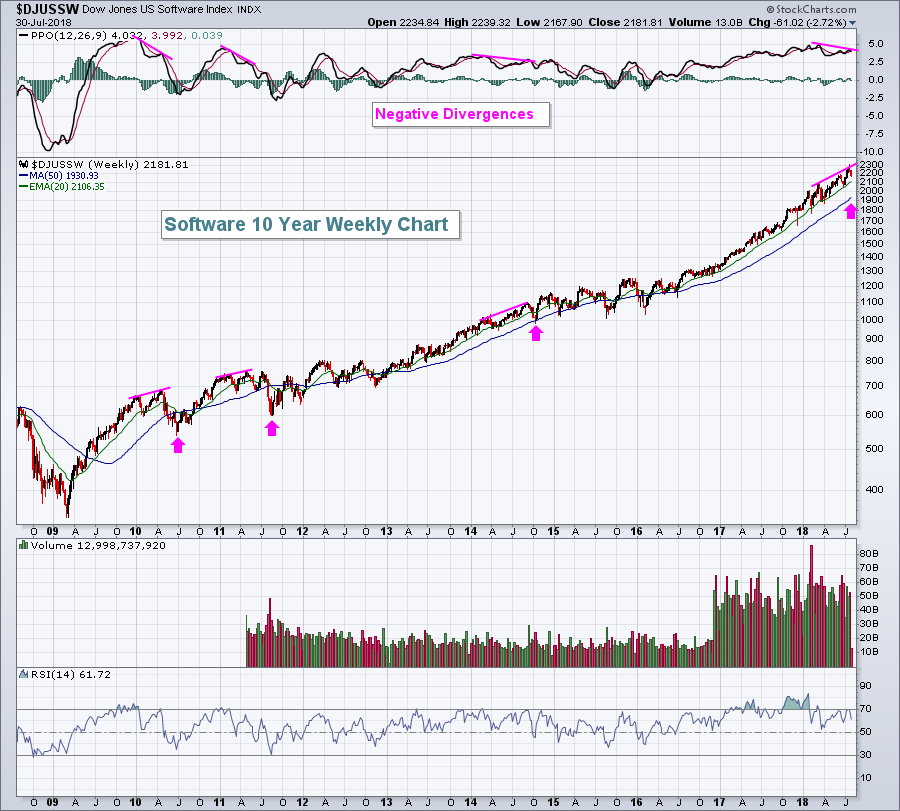
First, it was internet stocks as Facebook (FB) and Twitter (TWTR) dropped bombs on Wall Street in the form of quarterly earnings snafus. Yesterday, it was software's ($DJUSSW, -2.72%) turn. We do have to expect some profit taking from time to time, however, and the DJUSSW has been one of the market leaders during the recent leg of the 9 year old bull market. While I'm not afraid to buy software stocks for a quick relief rally, do keep in mind that we could see much more selling of software in the coming days and weeks:
 Software more than doubled in 2 1/2 years and has been up close to 70% in the last 18 months. Keep things in perspective. A healthy selloff in software wouldn't be the end of the world. Historically, the group struggles in September and we're rapidly approaching that calendar month. There's also a negative divergence in play on the weekly chart and that has been problematic in the past. It hasn't killed the bull market, but it has initiated industry rotation and that could be in the cards again. One amazing item to note about the above chart is that the DJUSSW has not had a weekly close beneath its rapidly-rising 20 week EMA in over two years. That simply doesn't happen very often. A close beneath it would likely trigger much more technical selling in the group, so be prepared for that.
Pre-Market Action
Crude oil ($WTIC) has dipped back beneath $70 per barrel and futures are slightly higher. The NASDAQ appears to be in line for a bit more of a rebound as its fortunes had turned of late with many technology names selling off. While I believe we'll see a rebound, I'm not so sure the gains will stick. Typically, selling episodes that fail to hold rising 20 day EMA support tend to turn into more intermediate-term selling and consolidation. With the recently rising Volatility Index ($VIX) closing at its highest level in a few weeks, nerves are a bit on edge. I'm looking for a bounce and then perhaps a little more selling so my trades will likely be short-lived, especially if I have opportunities to snag profits quickly.
With 30 minutes left to the opening bell, Dow Jones futures are higher by 15 points.
Current Outlook
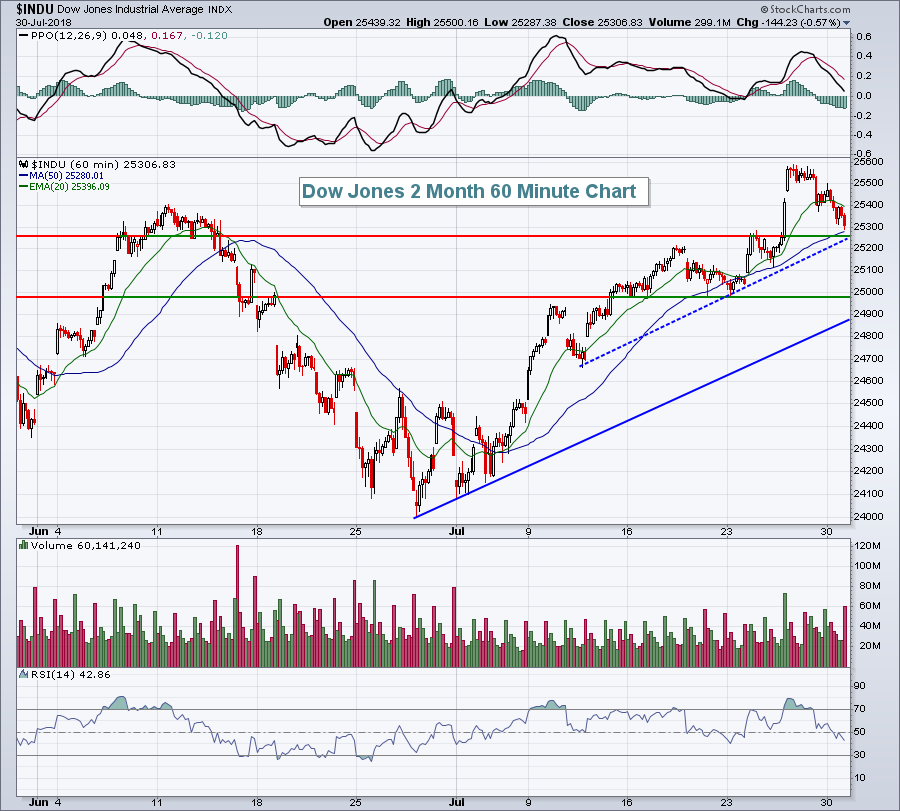
The Dow Jones Industrial Average ($INDU) has been the strongest index in July, and especially over the past week, as many of its beaten-down components have rallied and performed well on a relative basis. It's clearly the best looking index on an hourly chart:
 Despite the near 300 point drop over the past few days, the Dow still remains above its 50 hour SMA (currently at 25280) and its initial price support level at approximately 25260. Furthermore, its recent 3 week uptrend line (blue dotted line) intersects very near that 25260 level as well, providing additional support.
If we connect the lows at the end of June with the early July lows, we have another trendline support (blue line), that would suggest another trendline support approaching 24900. Since we have multiple recent price lows just beneath 25000, a secondary range of support resides from 24900-25000. I do not expect the recent outperformance of the Dow Jones to last, but so long as the U.S. Dollar Index ($USD) remains positioned beneath 95, current relative conditions could very well continue.
Sector/Industry Watch
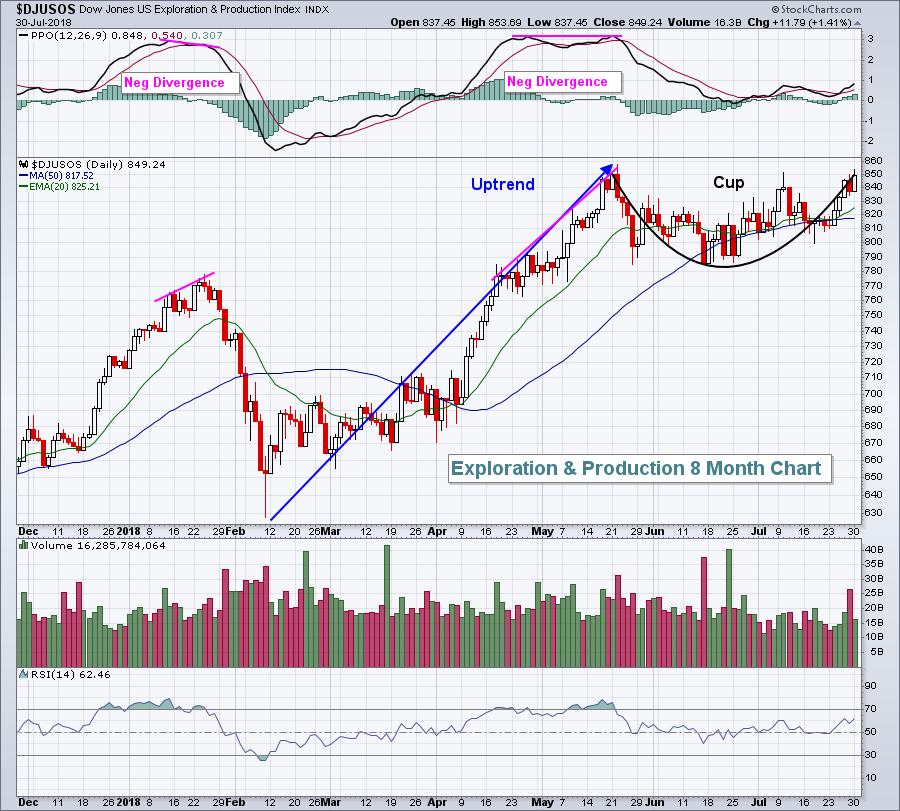
The Dow Jones U.S. Exploration & Production Index ($DJUSOS) has been a leader in the energy sector and, based on its current pattern, it appears that will continue after perhaps a brief pause:
 Previous tops were accompanied by negative divergences, signals of slowing price momentum and typically precursors to short-term bearish price action. Note that as the DJUSOS consolidates in this bullish cup (with perhaps a handle to the 20 day EMA to follow), the PPO has also been consolidating near its centerline. When we get the breakout here, price momentum is very likely to be accelerating, a bullish combination indeed.
Historical Tendencies
Since 1950, the S&P 500 has closed higher on the 2nd day of a calendar month (vs. the 30th of the prior calendar month) 59.29% of all calendar months. While it's obviously not a slam dunk, there are mathematical odds that favor the bulls this time of each calendar month. Much of this historical strength relates to incoming money flows (think 401(k) contributions from employers). Here are the annualized returns by calendar day during this period:
31st: +22.62%
1st: +45.21%
2nd: +36.83%
Compare those annualized returns to the average annual return of approximately 9% on the S&P 500. This is one of the strongest historical tendencies that I'm aware of and should be taken into consideration in your trading.
Key Earnings Reports
(actual vs. estimate):
ADM: 1.02 vs .78
AME: .83 vs .78
AMT: 1.90 vs 1.78
APTV: 1.40 vs 1.37
BP: .85 vs .85
CHTR: 1.15 vs .95
CMI: 4.14 vs 3.67
ECL: 1.27 vs 1.27
ETN: 1.39 vs 1.32
FIS: 1.23 vs 1.20
FMS: .54 vs .60
HMC: 1.18 vs .99
HRS: 1.78 vs 1.76
JCI: .81 vs .80
PFE: .81 vs .75
PG: .94 vs .90
SHOP: .02 vs (.02)
SHPG: 3.88 vs 3.67
SNE: 1.60 vs 1.16
SNY: .74 vs .72
WEC: .73 vs .66
(reports after close, estimate provided):
AAPL: 2.17
APC: .60
BIDU: 2.63
BXP: 1.56
DVN: .37
FISV: .74
IQ: (2.30)
OKE: .67
VRSK: 1.01
Key Economic Reports
June personal income released at 8:30am EST: +0.4% (actual) vs. +0.4% (estimate)
June consumer spending released at 8:30am EST: +0.4% (actual) vs. +0.4% (estimate)
May Case Shiller HPI to be released at 9:00am EST: +0.3% (estimate)
July Chicago PMI to be released at 9:45am EST: 62.3 (estimate)
July consumer confidence to be released at 10:00am EST: 127.0 (estimate)
Happy trading!
Tom


