Market Recap for Tuesday, August 21, 2018
Despite some selling late in the day, it was mostly a bullish day on Wall Street. The two sectors that lagged were defensive sectors - utilities (XLU, -0.72%) and consumer staples (XLP, -0.71%). Leading the market higher were consumer discretionary (XLY, +0.79%) and industrials (XLI, +0.74%). The XLY is featured in the Sector/Industry Watch section below. The latter, however, is being driven higher by strong transports ($TRAN), which recently broke out as reflected below:
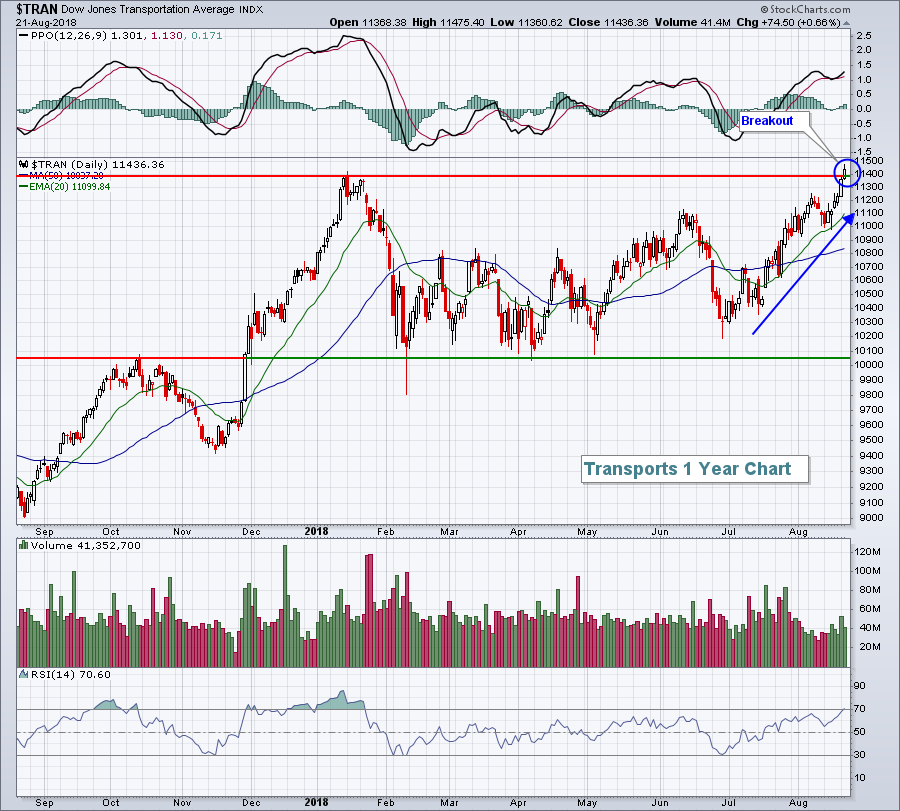 Railroads ($DJUSRR) have been the primary leader during the July-August rally in transports, although airlines ($DJUSAR) have also been quite strong and truckers ($DJUSTK) are nearing a breakout. On Tuesday, strength was seen in transportation services ($DJUSTS):
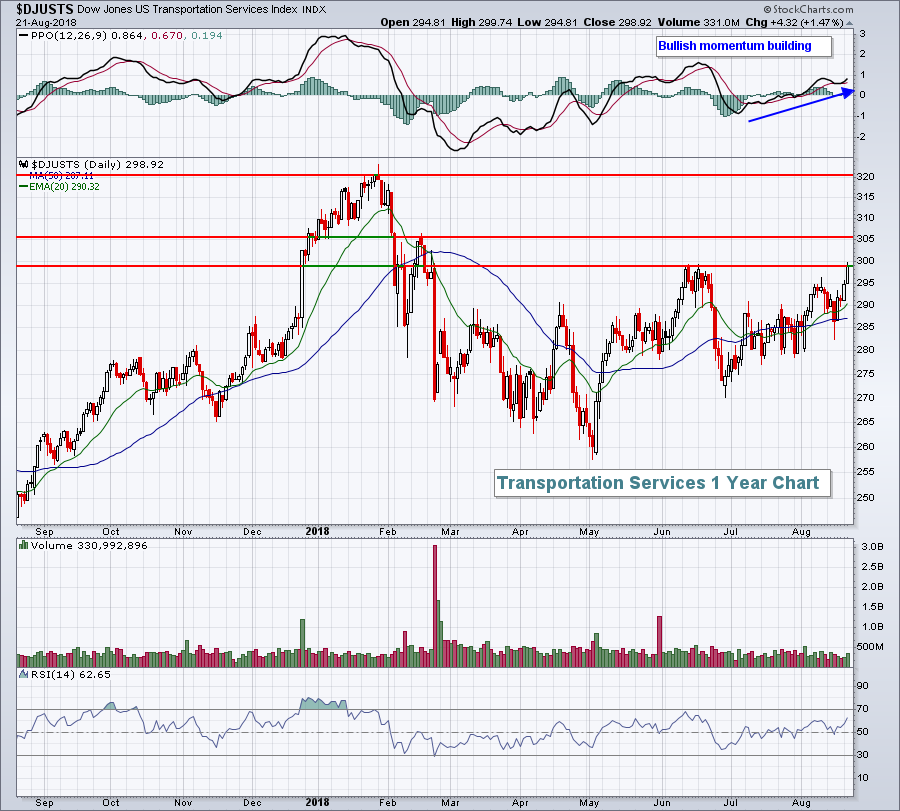 The 1.47% gain in the DJUSTS enabled the group to challenge its June high. The 300-305 area does present challenges in the form of key price resistance so a breakout would be extremely encouraging for industrials in general.
The big winner yesterday, however, was the home construction stocks ($DJUSHB, +5.28%) after Toll Brothers (TOL) delivered a much-better-than-expected quarterly report. The declining 20 week EMA has posed a significant problem over the past several months, but if the group can finish strong this week, it has a chance to break a significant downtrend:
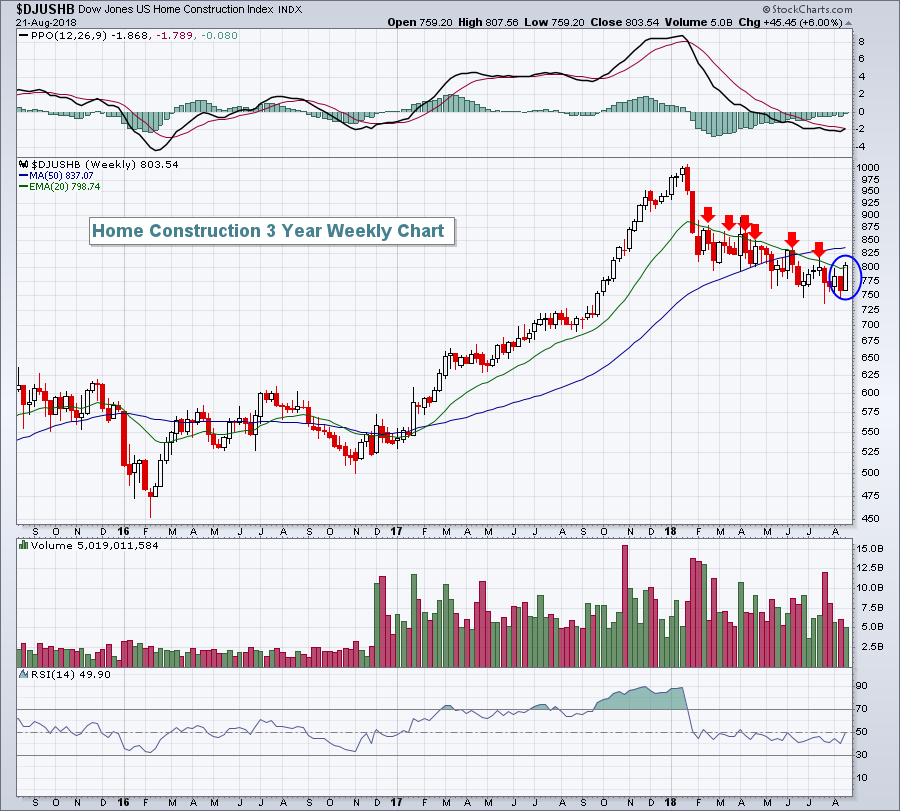 The week's not over and we did see a slight weekly close above the 20 week EMA back in early-April before selling escalated. But the action is definitely a start to a potential reversal and we should all be watching the developments here closely.
Pre-Market Action
Asian markets were mostly higher overnight, although China's Shanghai ($SSEC) closed with losses. In Europe, we're seeing mixed action.
The 10 year treasury yield ($TNX) continues to drift lower, down 3 basis points to 2.81% this morning. The stumbling dollar has created short-term interest in gold ($GOLD) with that metal higher by $8 to $1208 per ounce.
Target (TGT) had a blowout quarter and is up 6.5% in pre-market action. Still, sellers seem to have the upper hand as we approach the opening bell with Dow Jones futures down 28 points.
Current Outlook
The small cap Russell 2000 has broken out to another all-time high and that's a great signal for the U.S. economy. The U.S. Dollar Index ($USD) has been strong in 2018 and that, no doubt, has been adding fuel to the small cap fire. I expect to see further strength in the USD and that should bode well for a continuing rally in small caps, which broke out of a bullish ascending triangle on Tuesday:
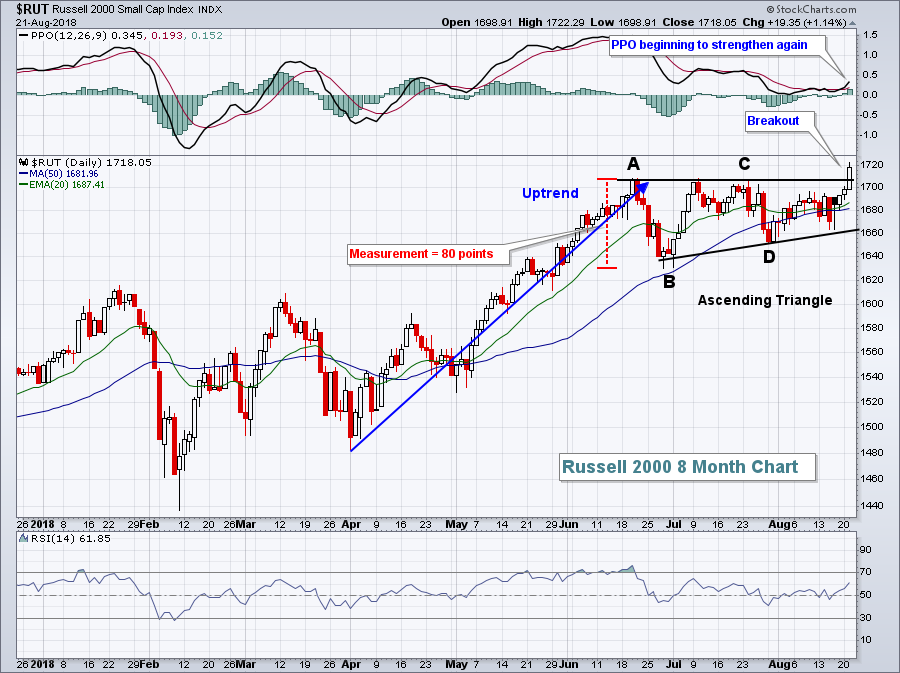 The A-B-C-D-E ascending triangle pattern is highlighted above with E being the confirmed closing breakout.
One advantage to technical patterns is that they provide initial targets based on measurements. In the case of an ascending triangle, you measure from Point A (initial top in triangle pattern) to Point B (initial reaction low in triangle pattern). That measurement is then added to the breakout level to determine an initial target. In the case of the Russell 2000, I'm now looking for an initial move to the 1790 area. That's another 4% or so from Tuesday's close. Keep in mind this is an initial target, not an ultimate target.
Sector/Industry Watch
Consumer discretionary (XLY, +0.79%) broke out to an all-time high on Friday and also closed at its highest relative level (vs. the benchmark S&P 500) in August after drifting lower on a relative basis for the six weeks leading up to August:
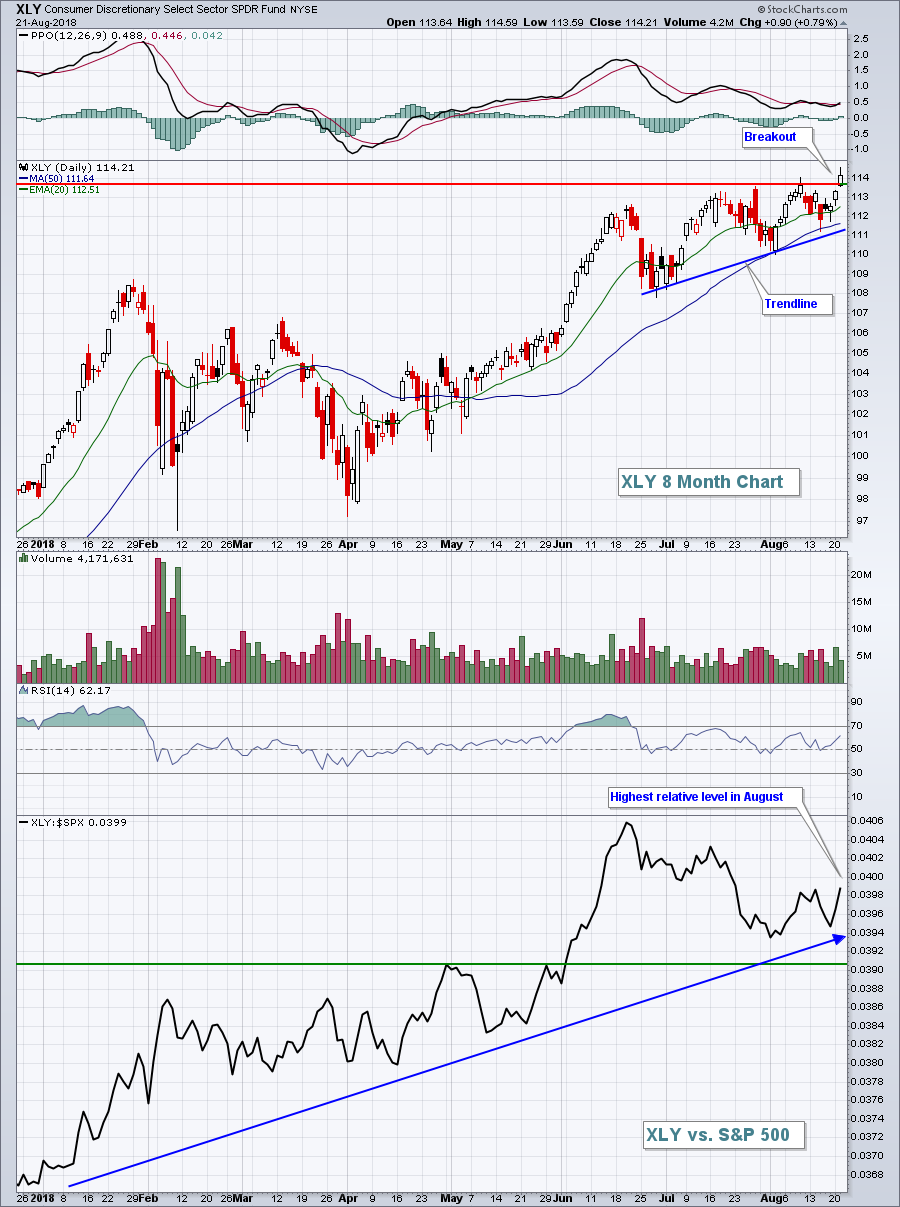 The XLY has been a driver behind the 2018 advance and was especially strong from mid-April through mid-June as retail stocks caught fire. Given that GDP is comprised 0f two-thirds consumer spending, strong performance by consumer discretionary stocks is generally vital to the health of a bull market. Things are looking up in that regard.
Historical Tendencies
Here's a very interesting stat on the small cap Russell 2000. Since its inception in the late 1980s, nearly all of the index's gain has come during the 25th of one calendar month through the 2nd of the next calendar month. Check out these annualized returns dating back more than 30 years:
25th-2nd: +45.55%
3rd-24th: +1.18%
Essentially, 25% of the calendar month has generated 98% of the returns.
Key Earnings Reports
(actual vs. estimate):
ADI: 1.53 vs 1.46
LOW: 2.07 vs 2.02
RY: 1.66 vs 1.62
TGT: 1.47 vs 1.40
(reports after close, estimate provided):
SNPS: .92
SQM: .38
Key Economic Reports
July existing home sales to be released at 10:00am EST: 5,420,000 (estimate)
Happy trading!
Tom


