Market Recap for Monday, August 6, 2018
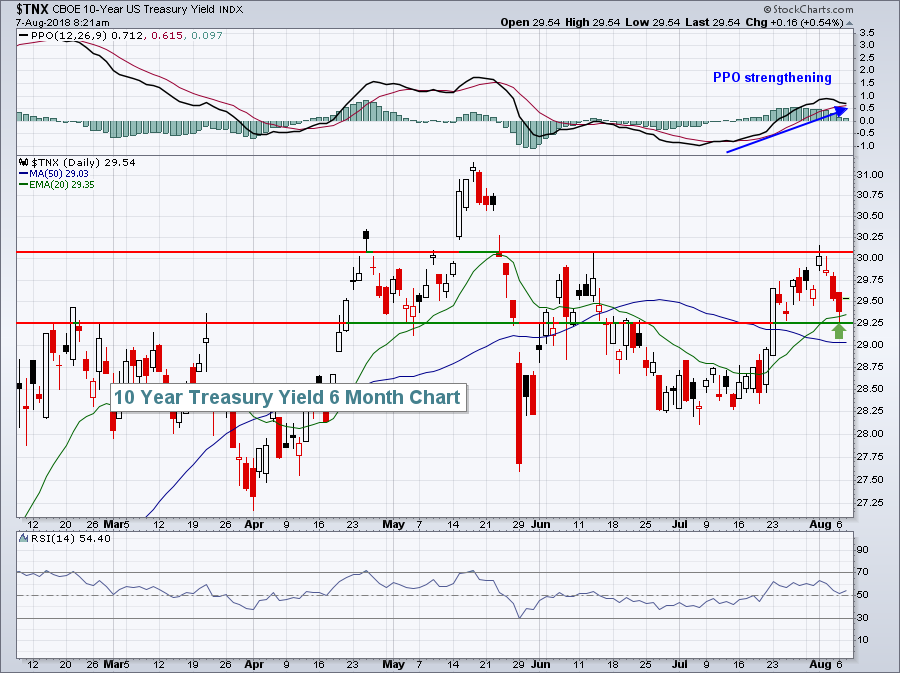
The Russell 2000 and NASDAQ paced a day of strength on Wall Street as they gained 0.65% and 0.61%, respectively. The S&P 500 and Dow Jones enjoyed smaller gains as money rotated back towards more aggressive areas. The 10 year treasury yield bounced at near-term yield support at 2.925%, a positive for equities:
 Two weeks ago, the TNX broke back up through 20 day EMA resistance and its PPO turned positive, crossing centerline resistance. When that occurs, I look to the rising 20 day EMA to provide support - and it did yesterday. Currently, the TNX range is from 2.925% to 3.01%. A break above 3.01% would signal bullish rotation away from treasuries, while a breakdown beneath 2.925% would signal the opposite.
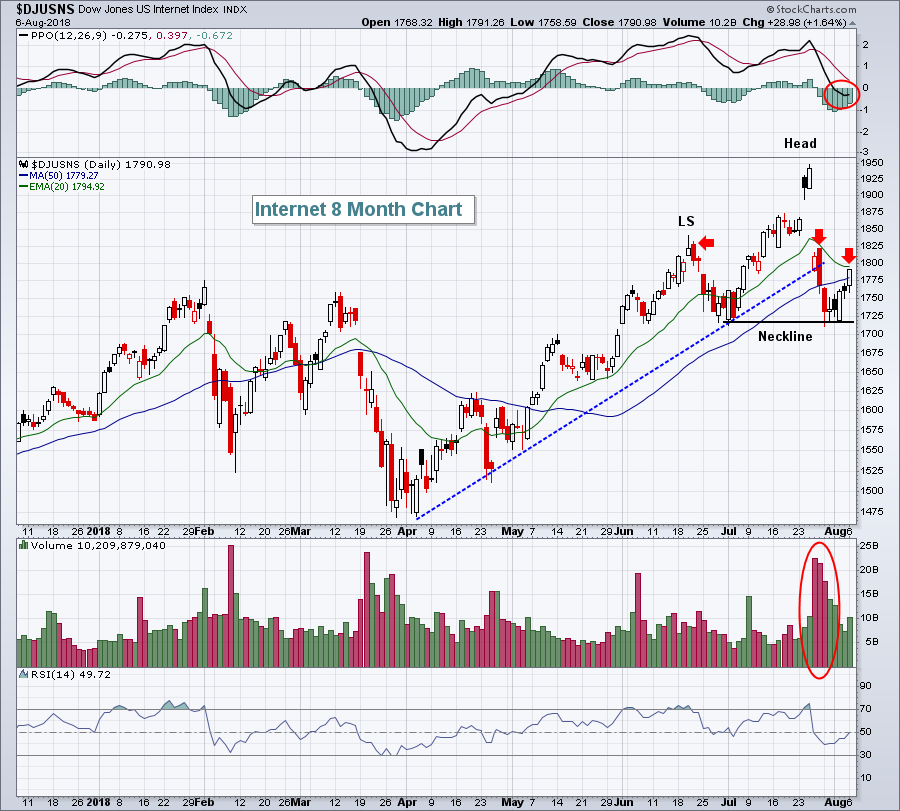
Consumer discretionary (XLY, +0.67%), technology (XLK, +0.54%) and financials (XLF, +0.53%) led the action to the upside. Internet stocks ($DJUSNS, +1.64%) are attempting to regain strength after back-to-back devastating earnings blows from Facebook (FB, +4.45%) and Twitter (TWTR, +3.19%). The first two tests for the DJUSNS are quickly approaching:
 The 1.64% climb yesterday was certainly encouraging as it beats the heck out of another steep decline, but the risks in the DJUSNS are rather obvious. First, the April through June uptrend line was broken on very heavy selling volume, a bearish development. The group has bounced, but the three red arrows mark key resistance at (1) the declining 20 day EMA, (2) gap resistance just below 1825, and (3) a potential right shoulder that could match the left shoulder in the 1840s. We're in a bull market, so I'm not really looking for topping patterns, but we should all be aware that one exists here. A heavy volume breakdown beneath neckline support at 1715-1720 would signal more weakness in internet shares ahead.
Pre-Market Action
The 10 year treasury yield ($TNX) is rising, continuing to bounce off yesterday's test of rising 20 day EMA support. The TNX is up 2 basis points and near 2.96%. The dollar has turned a bit lower this morning and that's provided a bit of a boost for gold ($GOLD) as that metal struggles to climb back above $1220 per ounce. Crude oil is up 1% and is nearing $70 per barrel.
Asian stocks were bullish overnight, gaining ground despite trade fears. China's Shanghai Composite ($SSEC) rallied 2.74%, its strongest one day rally in 2018. It came at a very opportune time as the SSEC hit 2700 for a second time in a month. European markets are rallying close to 1% at last check.
Dow Jones futures are higher by 89 points with 45 minutes left to the opening bell.
Current Outlook
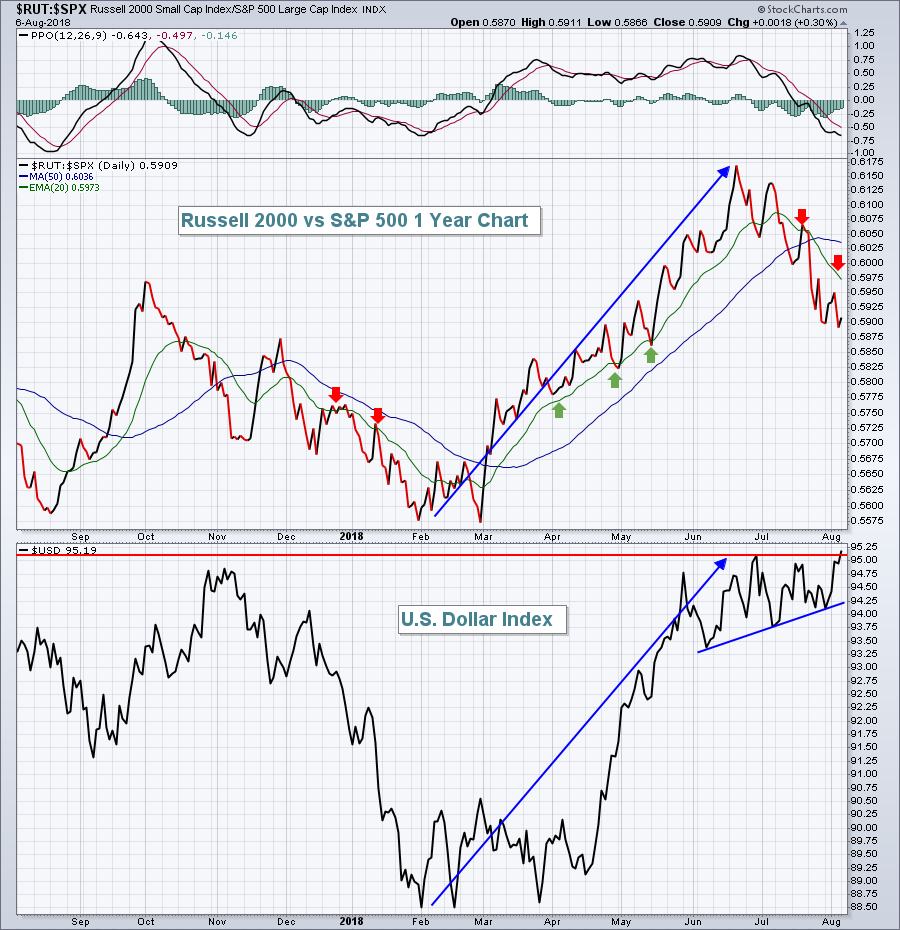
The U.S. Dollar Index ($USD) has been consolidating in very bullish fashion for the past couple months. That pause has allowed the benchmark S&P 500 to play "catch up" with the Russell 2000 small cap index. But it looks as if the USD is breaking out again. If that's the case, I'd expect to see money begin to rotate back towards small caps. We saw it yesterday and it could be the start of another big relative advance:
 You can see from the above that the meteoric rise in the USD during the first half of 2018 resulted in a strong relative advance in small caps. The dollar has consolidated in an ascending triangle, which typically ends with a breakout to the upside. The green and red arrows on the relative chart above ($RUT:$SPX) mark important relative support and resistance at the 20 day EMA. So a break back above that key moving average would signal another relative advance is underway.
Sector/Industry Watch
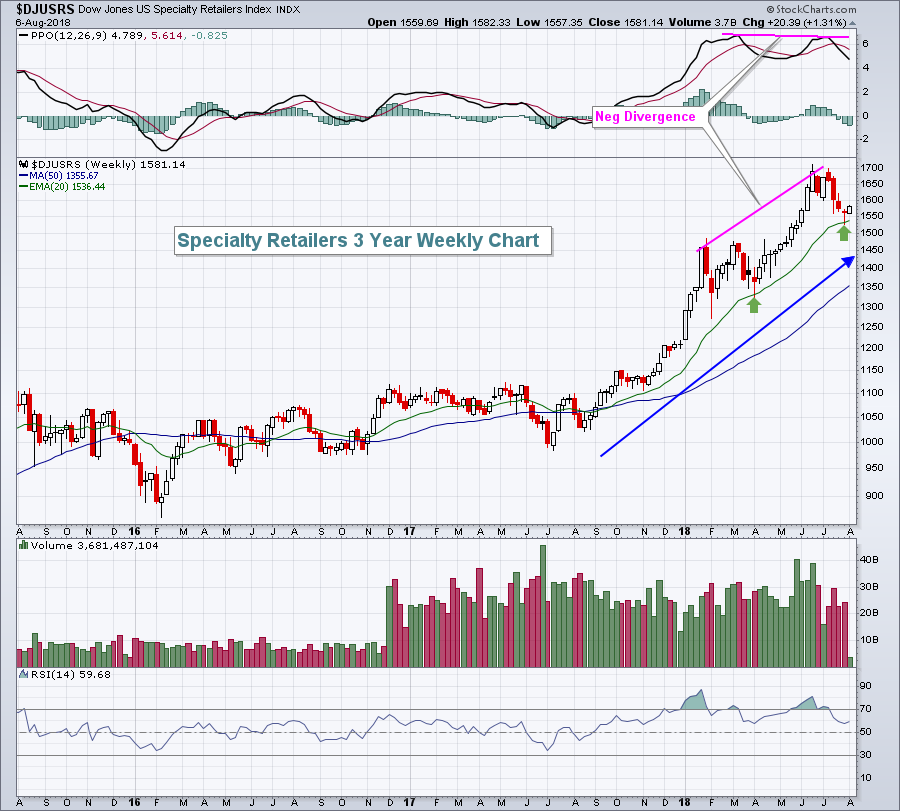
Specialty retailers ($DJUSRS), one of the darlings of Wall Street over the past 12 months, corrected approximately 10% during a recent six week stretch. Technically, the selling was almost scripted as the DJUSRS tested its rising 20 week EMA beautifully:
 There is a bigger issue brewing here in specialty retailers, however. The weekly negative divergence could become problematic, especially if we see a weekly close beneath the 20 week EMA. That would likely result in a 50 week SMA test, which isn't horrible when you consider where this group was situated one year ago. Still, traders have grown accustomed to strong stocks in this area.
Historical Tendencies
Recently, I highlighted the fact that August is a boring calendar month historically for the S&P 500. Performance in both the first and second halves of the month was equally boring since 1950 and near the flat line in terms of annualized performance. The NASDAQ isn't a whole lot different. The second half of the month does tend to perk up a little bit (+5.13%) from a weak first half (-3.21%), but neither are particularly bullish.
Key Earnings Reports
(actual vs. estimate):
BR: 1.86 vs 1.88
DISCA: .66 vs .84
EMR: .88 vs .86
EXPD: .79 vs .78
PPL: .55 vs .54
TDG: 4.01 vs 4.06
XRAY: .60 vs .59
(reports after close, estimate provided):
CLR: .70
DIS: 1.97
DXC: 1.75
HST: .51
PAA: .23
PXD: 1.54
SNAP: (.17)
Key Economic Reports
None
Happy trading!
Tom


