Note
I'll be traveling and on vacation this week, so my blog articles will focus on very brief topics regarding current market themes or my own trading strategies. I'll return to my "normal" blog postings regarding market action, outlook, historical tendencies, etc. when I return on Monday, August 20th.
Thursday, August 16th
If you've noticed, I generally include the RSI on nearly all my charts, but I rarely discuss it. From a momentum oscillator perspective, I much prefer the MACD and PPO. I used to plot the MACD on all of my charts but, to be quite honest, the PPO does everything the MACD does and it's based on the percentage difference between its 12 period and 26 period EMAs. That's better than the MACD, where the calculation is based on the dollar difference. Why is percentage better? Well, for two reasons. First, you can go back into the history of a long-term uptrending stock to see how much momentum is truly in the stock on a historical basis. Consider Amazon.com (AMZN) as an example. If you're looking at the dollar difference between 2008 and 2018, the MACD will be skewed because the price of AMZN is so much higher now. But if you use percentage difference, it doesn't matter what the price is. The second reason the PPO is better is that you can compare PPOs among stocks of all shapes and sizes to determine which truly shows the strongest momentum.
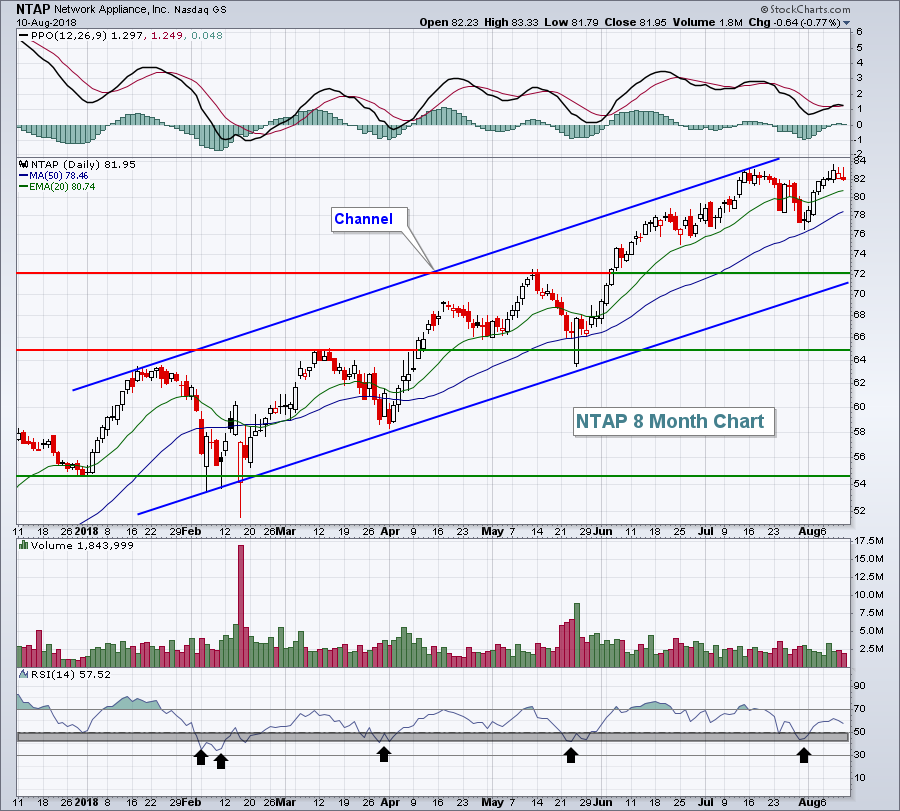
Because of my preference in using the PPO, the RSI normally resides at the bottom of my charts and I don't discuss it often. However, I've found that the RSI is much easier to scan for. One of my favorite scans is to look at my Strong Earnings ChartList for RSIs between 40-45. Why 40-45? Well, because my experience is that uptrending stocks, indices, ETFs, etc. tend to find short-term bottoms within uptrends with RSIs between 40 and 45. Let's look at Network Appliance (NTAP) as an example:
 It's clear that NTAP is uptrending and the stock has been reporting solid quarterly results over the past year. By scanning for RSI 40-45, check out when NTAP would appear on my scans (black arrows). The RSI did dip briefly into the 30s in early February, but notice that price support near 54.50 was never violated on a closing basis. This is also why RSI is never my primary indicator. My primary indicator is the combination of price and volume, without exception.
Happy trading!
Tom


