Market Recap for Friday, September 14, 2018
The NASDAQ struggled on Friday, while the Dow Jones and S&P 500 managed to finish with slight, fractional gains. The Russell 2000 was the clear outperformer, a bullish development as the U.S. Dollar Index ($USD) bounced off its recent price support level near 94.50:
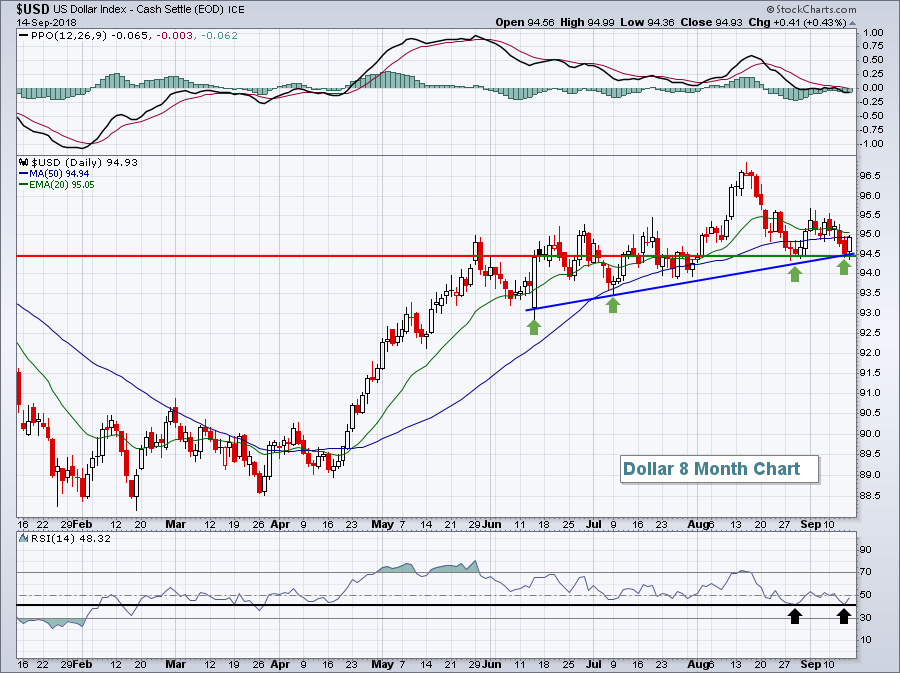 Losing short-term price and trendline support in the 94.40-94.50 level could be problematic for small caps, but the bounce on Friday at least gave the small cap bulls reason to buy.
Financials (XLF, +0.71%), energy (XLE, +0.53%) and industrials (XLI, +0.50%) led the market on Friday as all other sectors finished in the red. Utilities (XLU, -0.53%) and consumer discretionary (XLY, -0.37%) were the two primary laggards.
Semiconductors ($DJUSSC) bounced for a second straight day after printing its huge reversing candle last Wednesday at key 3350 price support. Further strength from the DJUSSC would be bullish for equities, especially the NASDAQ.
In the financial space, life insurance ($DJUSIL) enjoyed a big day and is once again nearing key price resistance:
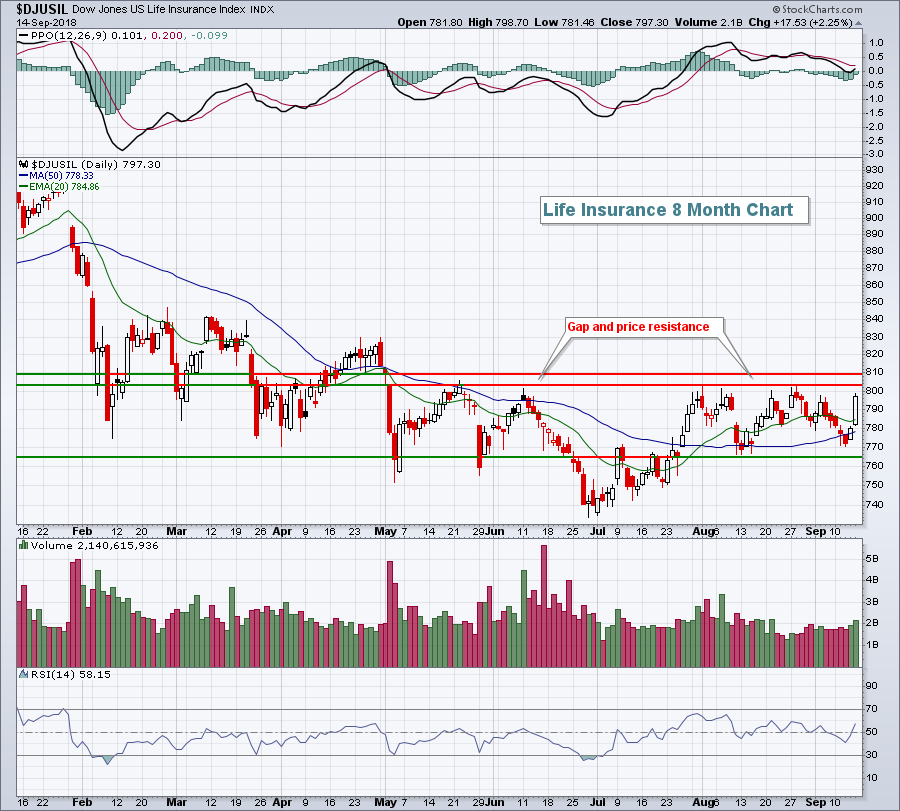 Financials are looking for leadership and they could certainly find it in the life insurance area if price and gap resistance in the 800-810 zone can be cleared.
Pre-Market Action
The 10 year treasury yield ($TNX) is above 3.0% this morning, currently residing at 3.01% and that could result in solid upcoming outperformance in financials if the breakout sticks.
It wasn't a great night overnight in Asia with the Hang Seng Index ($HSI) dropping 1.30%. China's Shanghai Composite ($SSEC) was also down more than 1% as trade tensions with the U.S. escalated. In Europe, we're seeing weakness across the board and that weakness is not helping futures here in the U.S.
Dow Jones futures are lower by 20 points as we approach the start of a new trading week.
Current Outlook
Transportation stocks ($TRAN) closed at another high on Friday, but it didn't come without some short-term concerns. The volume was extremely light and not indicative of a rally that's likely to continue and there's a negative divergence on the PPO that tells us that price momentum is slowing - a bad combo. This doesn't provide us a guarantee of lower prices, but it does signal caution:
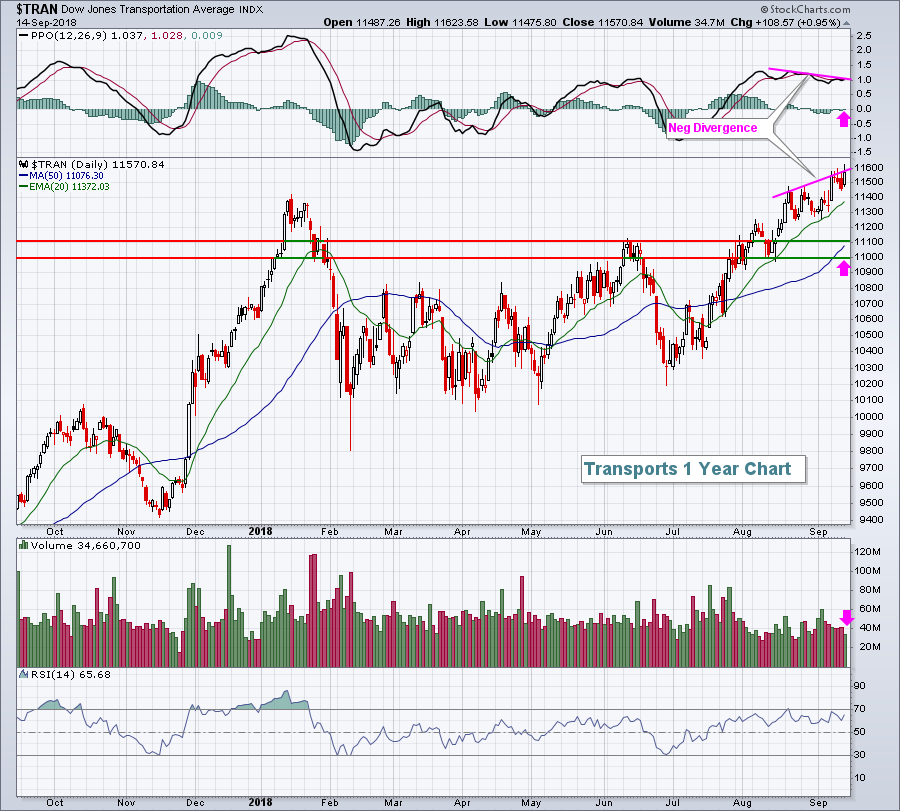 We're heading into the most bearish part of September (see Historical Tendencies below) so selling down to the rising 50 day SMA is certainly plausible. The bull market rages on, and I believe we're going higher in Q4, but a temporary pullback to unwind the price momentum issue isn't out of the question over the next couple weeks. Proceed with caution.
Sector/Industry Watch
The financial sector (XLF) now sports the lowest SCTR among the key sectors. That simply tells us that it hasn't been the place to park your money in 2018. It has not helped that the 10 year treasury yield ($TNX) has been stymied since topping at 3.11% in mid-May. But with the TNX flirting with a possible short-term breakout above 3.0% and a rare inverse correlation developing between the XLF and TNX, it could be a solid time to overweight the XLF or look for potential trade candidates in that space. The long-term technical picture remains bullish despite the XLF's relative weakness:
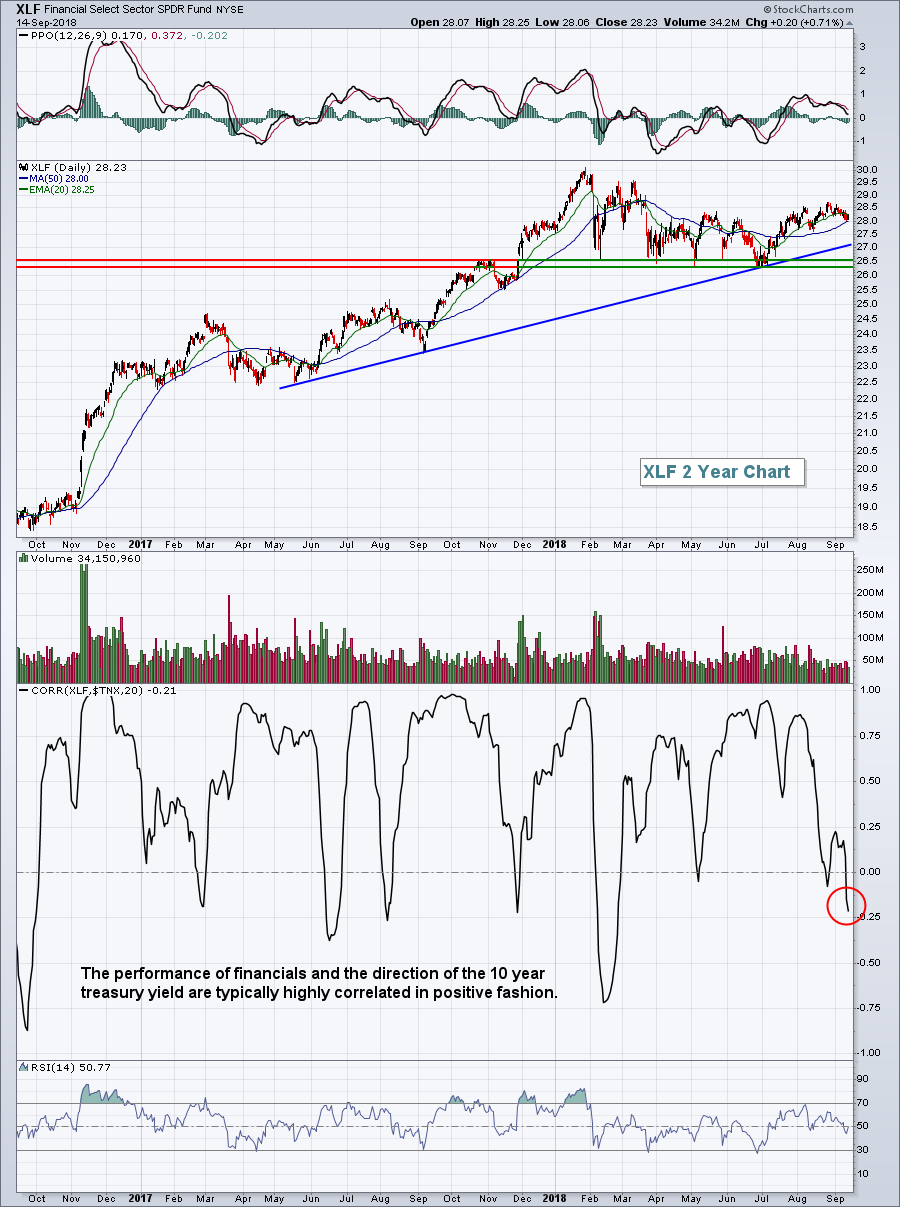 In my opinion, 26-27 remains significant support on the chart and we're well above that right now. I'd look for the correlation above to return to positive territory, meaning that we'll likely see the XLF and TNX begining to move together. Should the TNX break above key yield resistance at 3.0%, the XLF would likely be a major beneficiary.
Monday Setups
It's been hard to bet against the software group ($DJUSSW) in 2018 and several have delivered excellent quarterly results. Among those is Verint Systems, Inc. (VRNT), which posted revenues of $308.5 million vs. $296.8 million and EPS of $.76 vs. $.63. After easily topping estimates, VRNT soared 10% the next trading day, but has since pulled back close to 8% and is quickly filling its gap. I'm expecting VRNT to reverse sooner rather than later and claw its way back to 52:
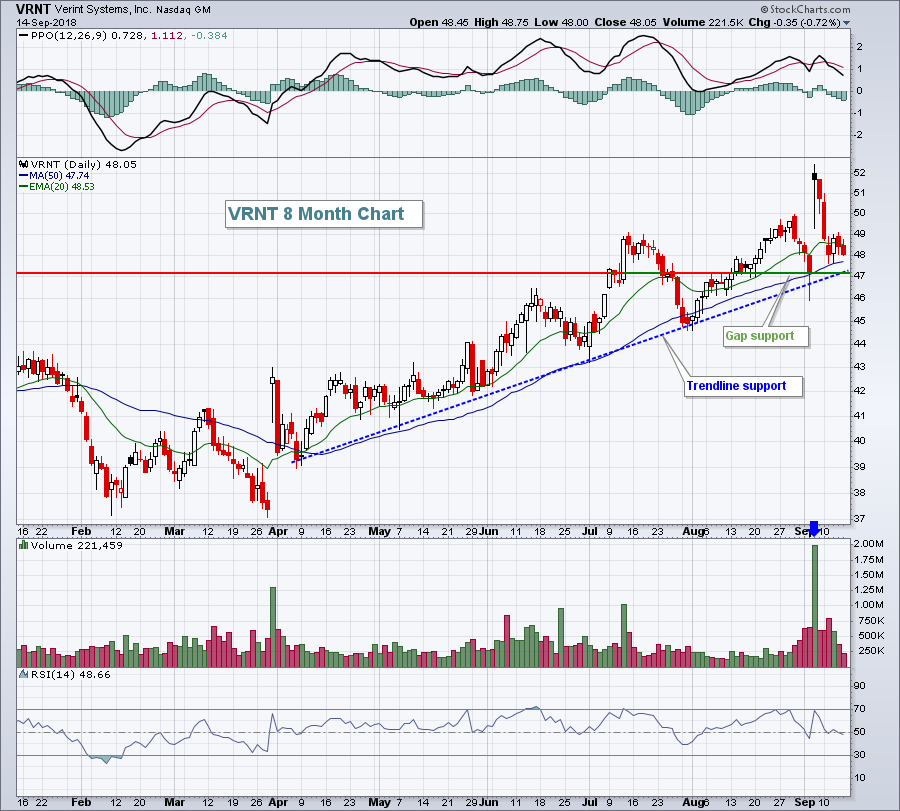 At the current price, VRNT has a dollar down to key price, gap and trendline support at roughly 47. It has four dollars to price resistance, its recent price high, near 52. That's a 4 to 1 reward to risk ratio, which is quite favorable and the closer that VRNT moves to 47, the better the reward to risk ratio.
For other potential Monday Setups, CLICK HERE.
Historical Tendencies
We are entering one of the worst historical periods of the year. September is known as a bearish month for U.S. equities, but the second half of the month is much worse than the first half. Here are the annualized returns for the S&P 500 since 1950 for each of the two periods indicated:
September 1-16: +10.63%
September 17-30: -23.13%
Key Earnings Reports
(reports after close, estimate provided):
FDX: 3.78
ORCL: .68
Key Economic Reports
September empire state manufacturing survey released at 8:30am EST: 19.0 (actual) vs. 23.0 (estimate)
Happy trading!
Tom


