Market Recap for Wednesday, September 19, 2018
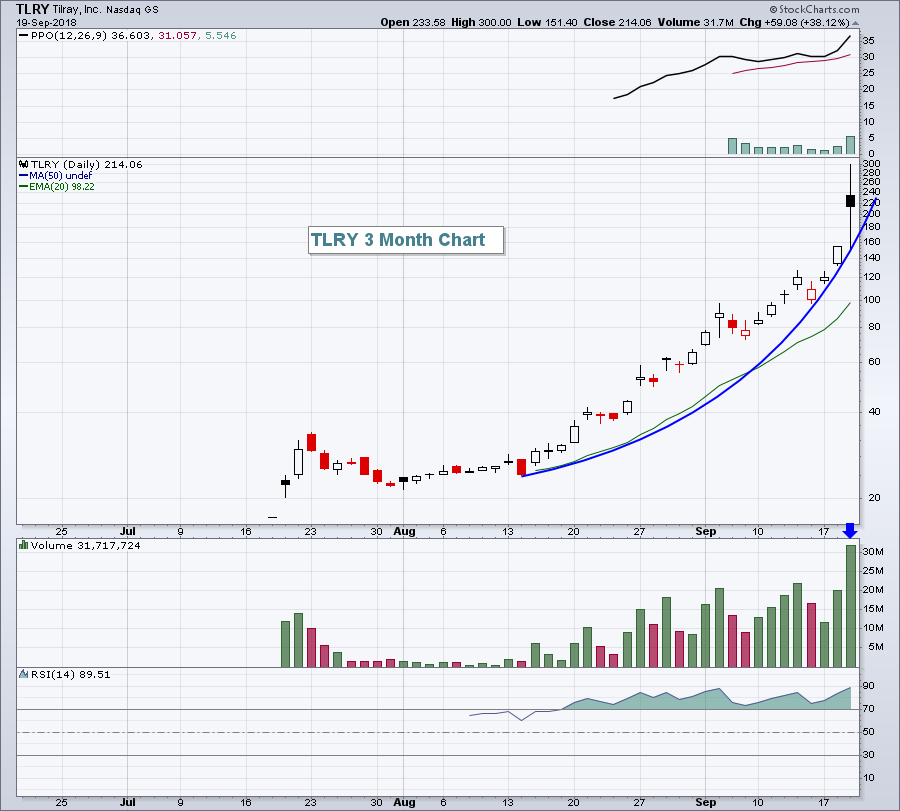
The biggest news stories technically-speaking yesterday were the breakout in financials (XLF, +1.70%) and the rising 10 year treasury yield ($TNX), which closed at 3.08% and is just 3 basis points from testing a 7 year high. But September 19, 2018 will likely be remembered more for the wild trading day for cannabis stocks. One of the most visible, Tilray (TLRY), went on a ride that would have impressed any amusement park enthusiast. TLRY's CEO Brendan Kennedy joined Jim Cramer on CNBC's Mad Money Tuesday evening and suggested that his business should be appealing to every major pharmaceutical company as a "smart hedge". Cannabis stocks had already enjoyed a crazy ride higher since the beginning of August and it was topped off yesterday with individual stock gains rarely seen on Wall Street. TLRY finished the day up 38.12%, but earlier in the session had nearly doubled as trading insanity arrived:
 Ever wondered what a parabolic rise looked like on a chart? Wonder no more. It's difficult to say whether a major top occurred yesterday, but keep in mind that at yesterday's close, TLRY is valued at more than $19 billion. There are a TON of hopes and dreams built into TLRY's stock price and dreams don't always come true.
Another cannabis-related stock, New Age Beverages Corp (NBEV), is set to announce on October 8th its CBD product portfolio at the North American Convenience Store Show in Las Vegas. CBD is one of the most medicinal compounds in the cannabis plant and so its possibilities are certainly significant. But Wall Street will need to weed out the high-flyers from the pipe dreams as the regulatory environment buzzes (lots of puns intended).
Financials enjoyed another solid day as the TNX soared, extending its 3-4 week uptrend that has seen the TNX move from 2.81% to 3.08%. Life insurance ($DJUSIL) was a major beneficiary and that group is featured below in the Sector/Industry Watch section.
Pre-Market Action
The weekly initial jobless claims of 201,000 once again set a 5 decade low, underscoring the strength of the U.S. economy. The 10 year treasury yield ($TNX) has climbed to 3.09%, moving closer and closer to the 7 year high of 3.11% set in May 2018.
Asian stocks were mixed and close to flat overnight, while European stocks are moving higher. U.S. stocks are set to open higher as Dow Jones futures are up more than 100 points with just under 45 minutes left to the opening bell. The Dow Jones will be looking to close above 26,617, its all-time closing high, to join the other major indices in record high territory.
Current Outlook
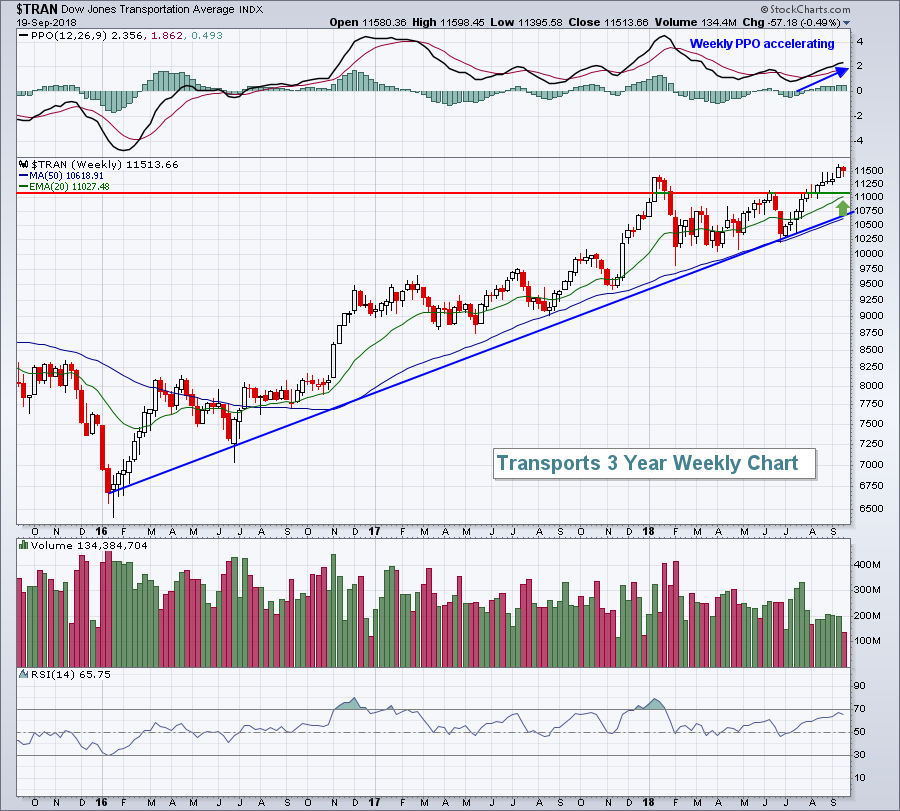
On Monday, I provided a daily chart of transportation stocks ($TRAN) in this section, discussing the possible implications of a negative divergence coupled with a bearish engulfing candle. The potential resolution discussed was a 50 day SMA test closer to 11000. I should mention that the weekly chart is very bullish, confirming what I believe will be a strong Q4 ahead for U.S. equities. But even on this bullish chart, a short-term bout of selling down close to 11000 wouldn't be bad technically:
 The TRAN has risen more than 10% in the past 10 weeks and certainly deserves a pause. Whether we see one remains a big question, but I wouldn't turn bearish on this group if we do in fact see a short-term breather.
Sector/Industry Watch
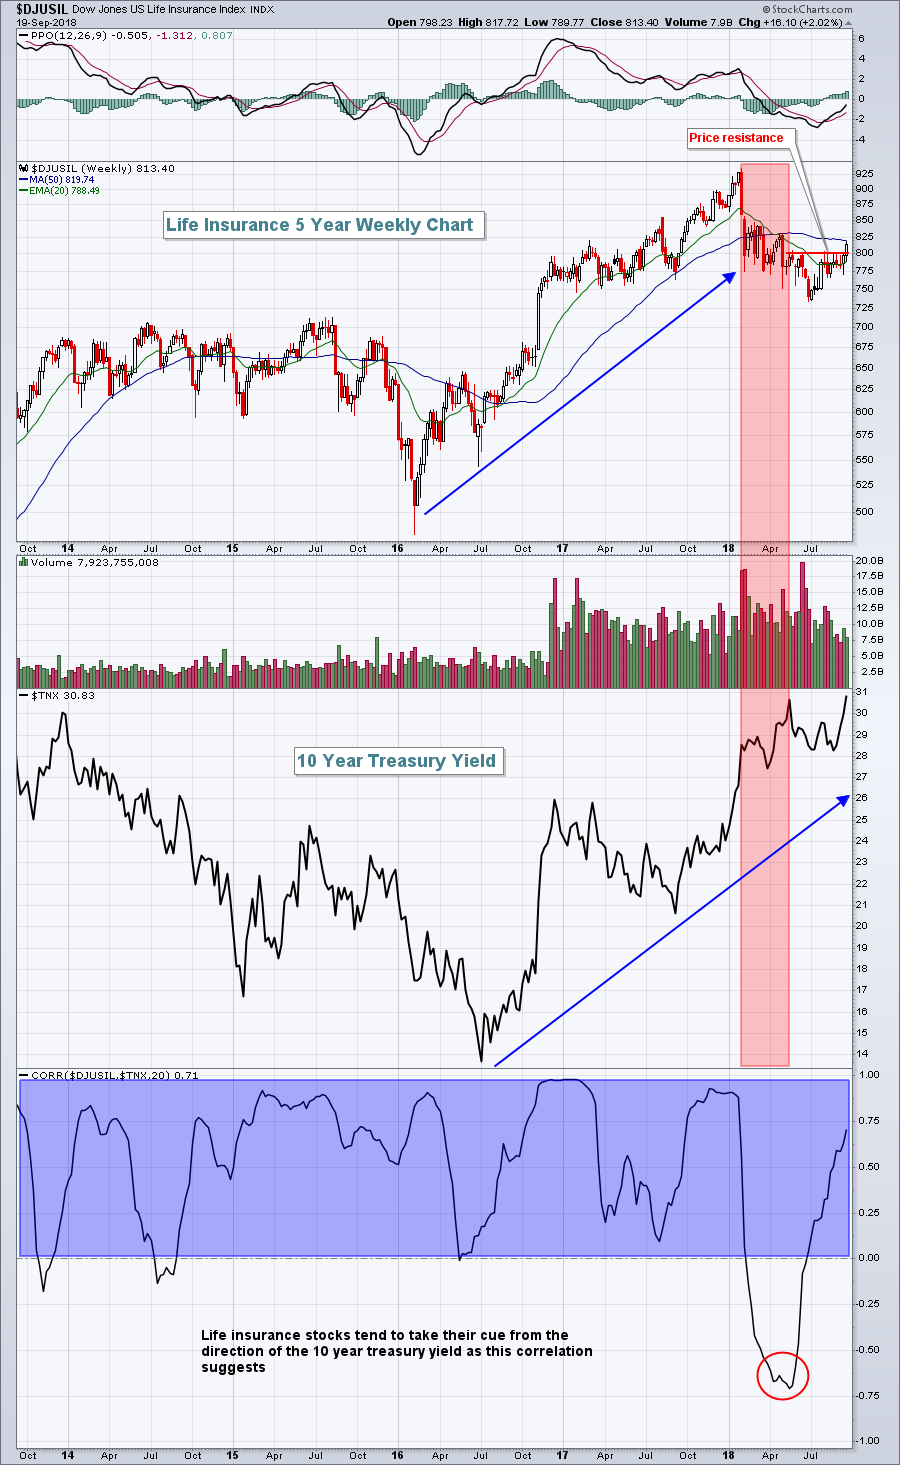
Life insurance ($DJUSIL) finally responded to rising treasury yields. There's been a very strong positive correlation between the two for many years, but despite a nearly month-long push higher in the TNX, life insurance barely budged. That changed yesterday:
 The blue shaded area highlights the positive correlation. But the red shaded area highlights how this positive correlation went off the tracks for several months in 2018. Now that the TNX is on the rise and the DJUSIL has broken above key price resistance at 810, the positive correlation has resumed. If I'm right about the TNX heading higher during the balance of 2018 and into 2019, then participation in life insurance stocks would seem to be a prudent investment.
Historical Tendencies
The Russell 2000 ($RUT), for the second time in the past three days, lost its short-term price support near 1707. Its recent relative underperformance can be tied directly to the weakness in the U.S. Dollar Index ($USD). The RUT is also in the midst of one of its most bearish historical periods of the year - September 17th through October 9th. Since 1987, the RUT has seen gains on 232 days and losses on 276 days with an annualized return of -44.20%. Only 5 calendar days within this 23 day period have posted annualized gains, while 6 different calendar day in the period have annualized losses in excess of 100%.
For whatever reason, seasonality favors larger cap stocks as we move into early October.
Key Earnings Reports
(actual vs. estimate):
DRI: 1.34 vs 1.23
THO: 1.67 vs 1.93
(reports after close, estimate provided):
MU: 3.32
Key Economic Reports
Initial jobless claims released at 8:30am EST: 201,000 (actual) vs. 210,000 (estimate)
September Philadelphia Fed Survey released at 8:30am EST: 22.9 (actual) vs. 19.6 (estimate)
August existing home sales to be released at 10:00am EST: 5,360,000 (estimate)
August leading indicators to be released at 10:00am EST: +0.5% (estimate)
Happy trading!
Tom


