Market Recap for Friday, October 12, 2018
Finally, Wall Street saw buying pressure to end a trading session. That certainly felt great psychologically, although as I point out below, I doubt that the short-term bottom is in. It's possible, but the odds favor another short-term plunge. For now, however, let's rejoice in the market's Friday reversal. All of our major indices finished the day in positive territory, but it was quite an effort for the Russell 2000 small cap index to turn positive. The RUT performed horribly on a relative basis throughout the session and needed a serious late afternoon bounce to end in positive territory by 1 point. Leadership was felt in the aggressive NASDAQ index as technology (XLK, +3.21%), communication services (XLC, +2.23%) and consumer discretionary (XLY, +1.85%) rebounded to lead an oversold market.
Every industry group within technology gained at least 1%, led by a very beaten-down software group ($DJUSSW, +3.48%). The recent break below its 50 day SMA was on extraordinarily high volume, so any upcoming test of the now-declining 20 day EMA should be monitored closely. A move back through with conviction would be bullish. Otherwise, I'd be skeptical:
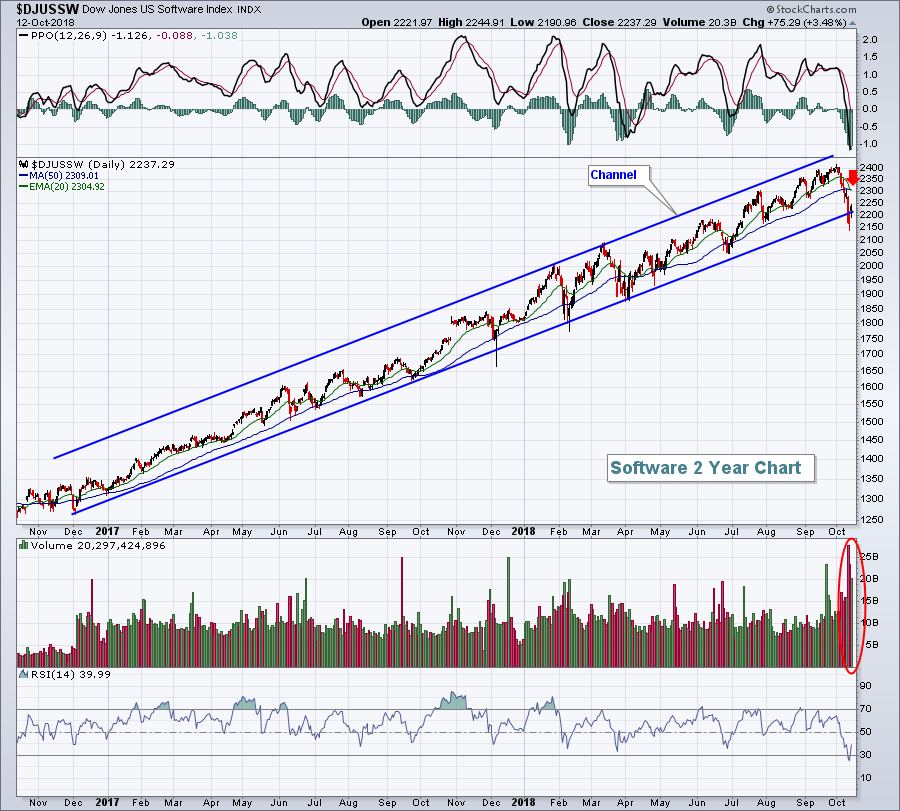
Software has been one of the market's leaders throughout the past two years of this bull market. A breakdown here on very heavy volume needs to be respected. I don't believe the long-term bull market has ended and software may eventually return to its leadership role. But ignoring bearish technical developments is never wise in my opinion. Market rotation isn't a bad thing unless you're highly leveraged in the area where money is rotating OUT. The declining 20 day EMA will provide us clues when the DJUSSW tests this key moving average.
Pre-Market Action
The U.S. Dollar Index ($USD) is lower this morning, aiding a further advance in gold ($GOLD), which at last check was up another $12 per ounce to $1234. The short-term bullishness in GOLD should not be questioned, but be careful if $1220 doesn't hold as support on a pullback. GOLD has been a significant underperformer relative to the S&P 500 for 7 years so technical support failures should not be taken lightly. It is a solid short-term long play, however, so long as support does hold.
Among global markets, Asia was very weak overnight, while European markets are clinging to small gains this morning. Dow Jones futures have been a bit volatile this morning, but are currently well off of their lows. Still, they are pointing down, lower by 24 points roughly 45 minutes before the opening bell.
Current Outlook
When market volatility ($VIX) explodes to the upside, the market trades much more on emotion than it does on technical conditions. Panic sets in and buyers go on strike until the market begins to settle down. Bounces do begin to offer encouragement as market makers finally begin to do what they're supposed to do, which is to provide liquidity during periods when there is a selling imbalance. Until bounces begin to occur, you have to be very, very careful and avoid buying and essentially stepping in front of that freight train. Let's take a look at the last two significant bouts of high volatility (panicked selling). First let's look at January-February 2018 on a 60 minute chart:
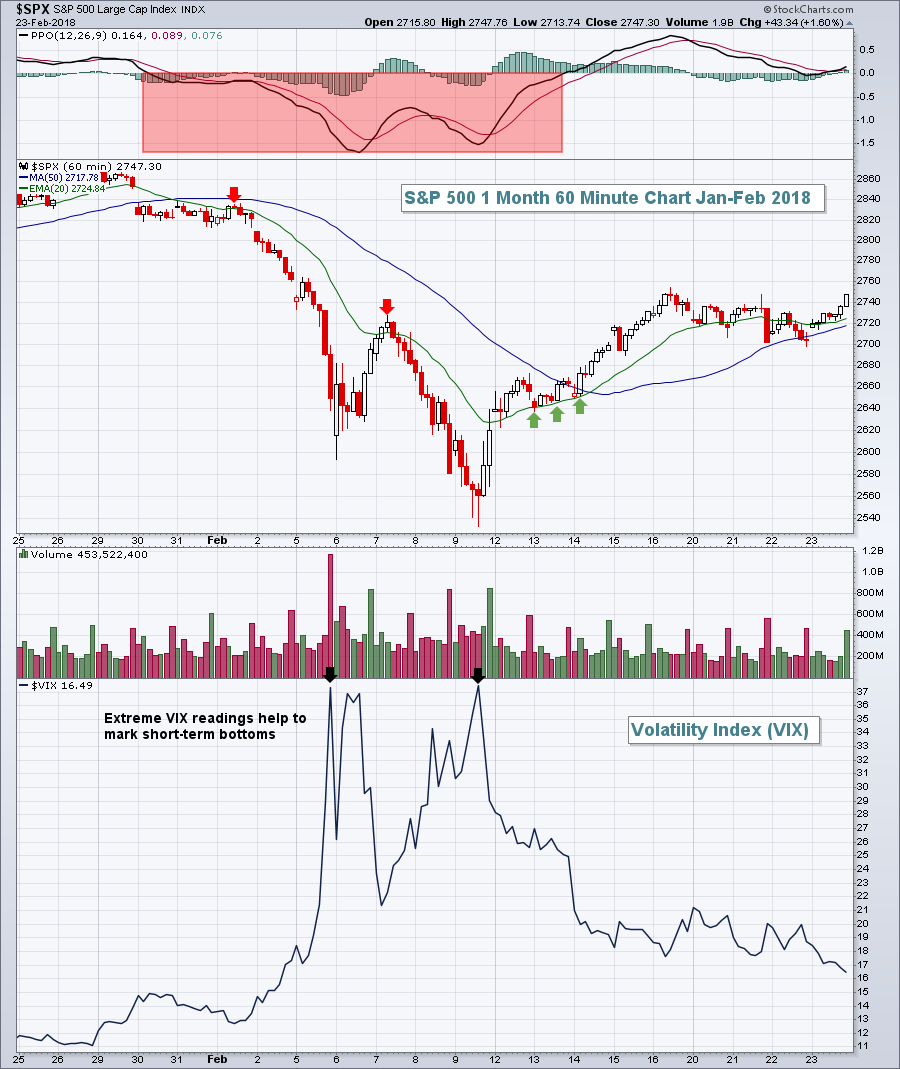 An hourly PPO below zero is problematic during short-term, high volatility periods. Bounces are welcome relief, but typically lead to more short-term selling. A similar selling episode occurred in March-April 2018:
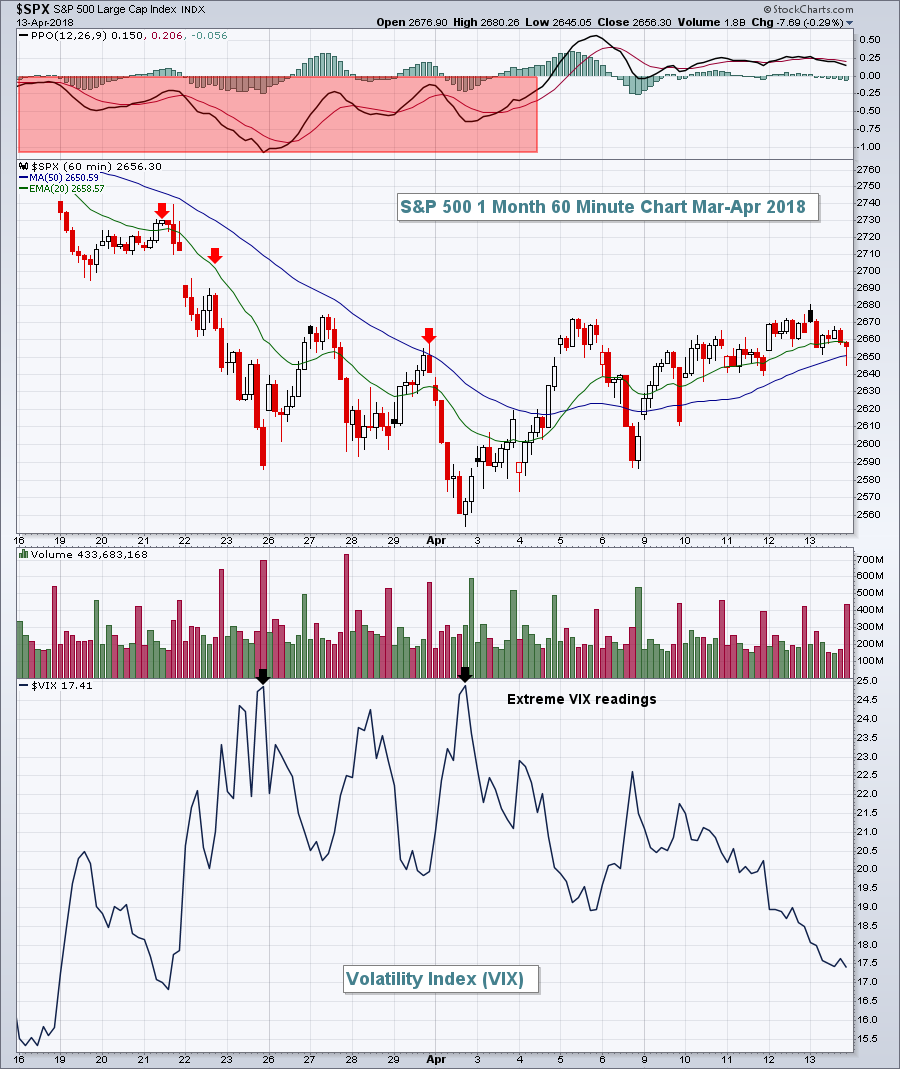 In both of these cases, the S&P 500 didn't begin to trend higher again until the 50 hour SMA and PPO centerline resistance were both cleared. Trying to call bottoms before this combination occurs can be quite dangerous. Let's look at where we stand to start this week:
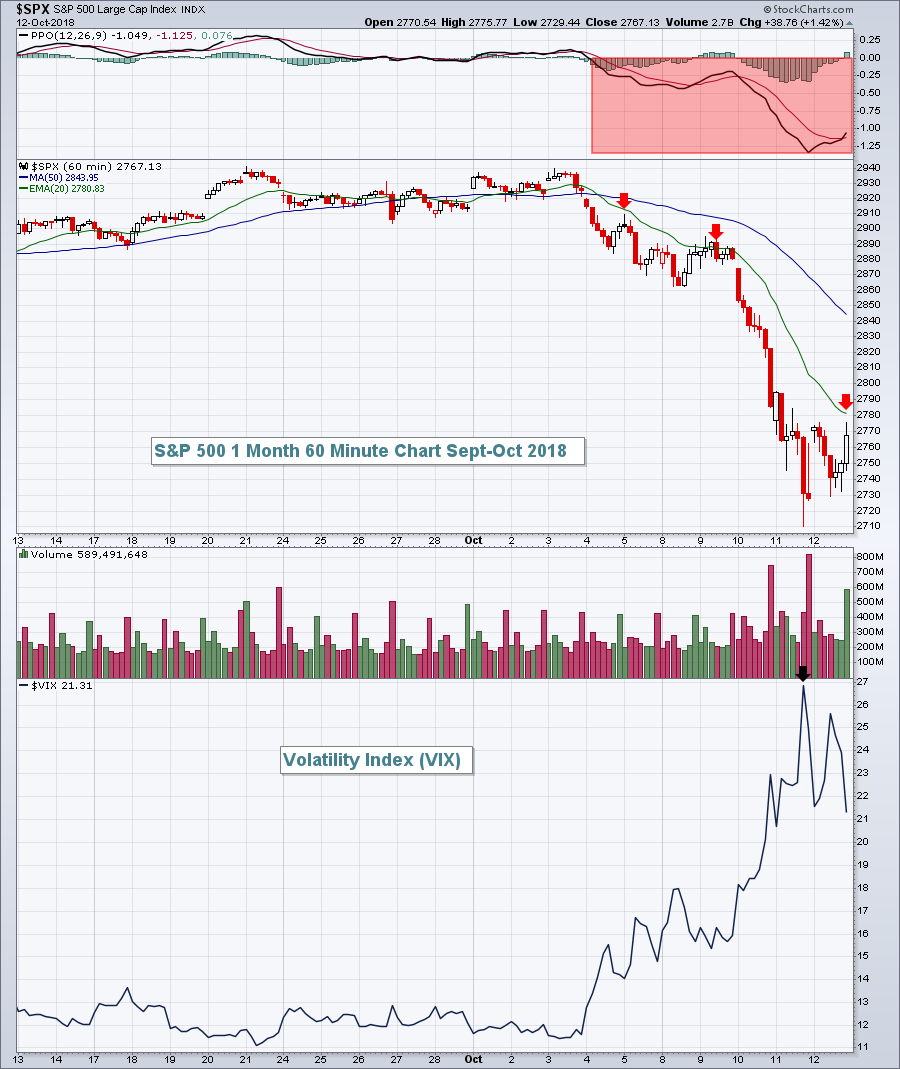 Based upon how the other highly volatile periods played out, it looks to me like it's too early to try to call a bottom from last week. If earlier periods in 2018 are any indication, we should look for at least a test of last week's lows, if not a further move lower. The very first thing that needs to happen from a bullish perspective is to clear the declining 20 hour EMA. No bounces should be construed as bullish until this first step is accomplished. Then we can move on to 50 day SMA and PPO centerline tests.
Stay cautious in the near-term.
Sector/Industry Watch
The worst performing sector during 2018 has been materials (XLB), which has fallen 10.00%. The group is ready for the "good ole days" when the U.S. Dollar Index ($USD) was falling:
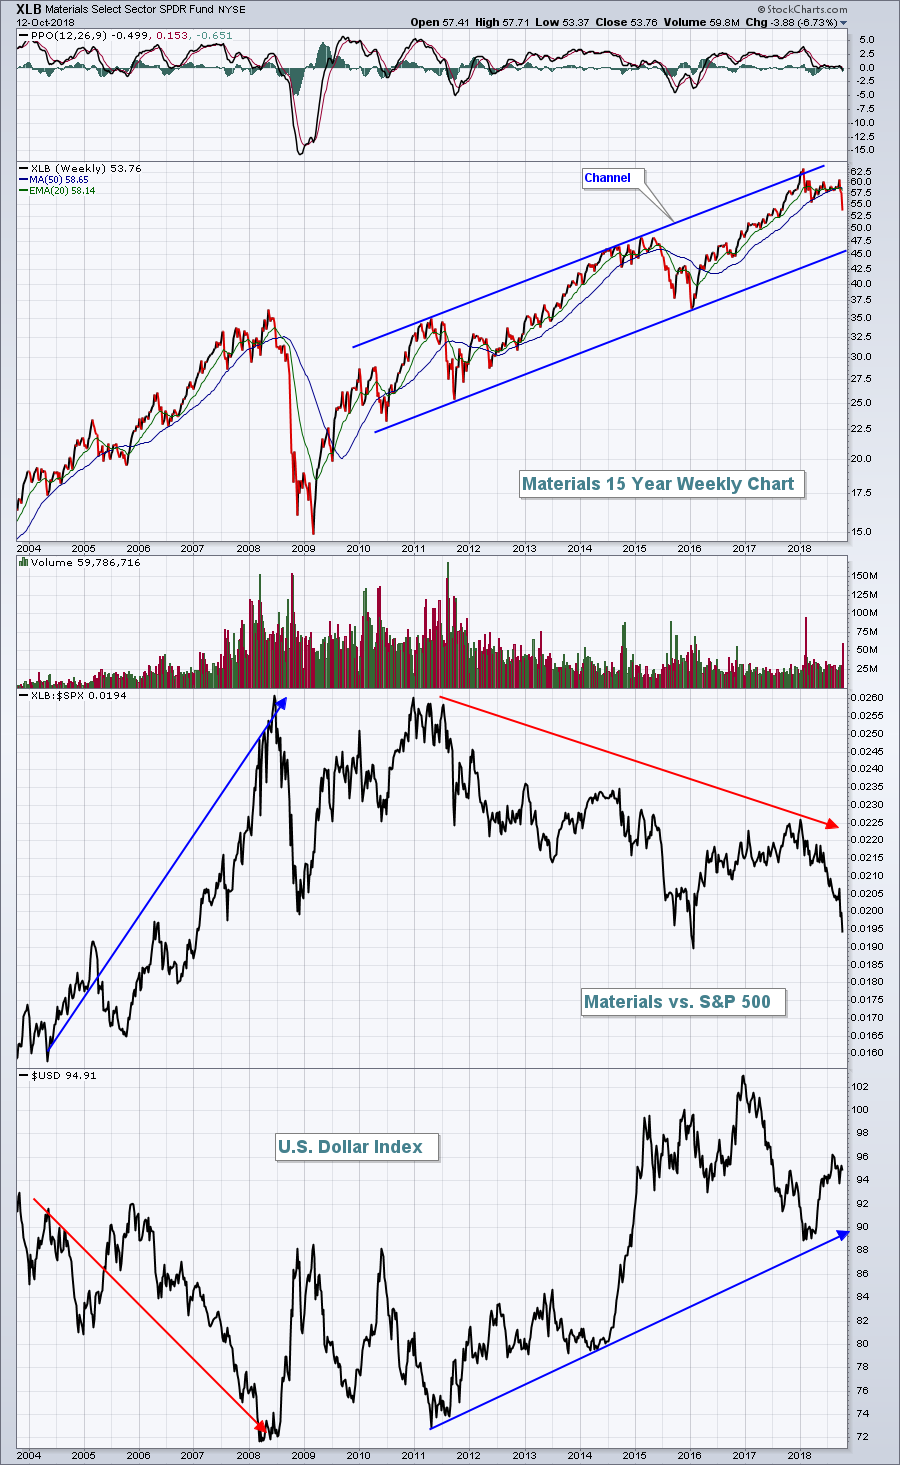 Strength and relative strength are two different animals and the above chart shows how the XLB's relative performance (vs. the benchmark S&P 500) changes based on head winds or tail winds provided by the U.S. Dollar ($USD). A key characteristic of bull markets is wide participation. From the above chart, you can see that materials stocks have been trending higher throughout the bull market. Unfortunately, the rising USD has put a lid on relative performance. The USD has been on the move higher in 2018 - check out the relative freefall in the XLB. While the 10% drop in the XLB has been painful, the longer-term uptrend remains in play. Unfortunately, don't expect leadership from this group so long as the USD continues to rise.
As a final note, check out the previous bull market from 2003 to 2007. The USD was falling and the XLB:$SPX ratio was in an uptrend, highlighting the outperformance during that period. Not all bull markets are the same.
Monday Setups
I'm going to skip Monday Setups for this week as I believe the highly volatile market conditions have created an unsafe trading environment. Let's allow the market to settle down and we'll take another look next week.
Historical Tendencies
For historical periods lasting a week or longer, the absolute best period of the calendar year is fast approaching. Since 1950, the October 28th through November 5th period has produced annualized return of +66.72%. But there's one problem first. The October 22nd through 27th period is the worst period of the year, producing annualized returns of -41.24% over that same 68 year stretch.
Key Earnings Reports
(actual vs. estimate):
BAC: .66 vs .62
SCHW: .64 (estimate, awaiting results)
Key Economic Reports
September retail sales released at 8:30am EST: +0.1% (actual) vs. +0.6% (estimate)
September retail sales less autos released at 8:30am EST: -0.1% (actual) vs. +0.4% (estimate)
October empire state manufacturing survey released at 8:30am EST: 21.1. (actual) vs. 18.8 (estimate)
August business inventories to be released at 10:00am EST: +0.5% (estimate)
Happy trading!
Tom


