Market Recap for Monday, October 29, 2018
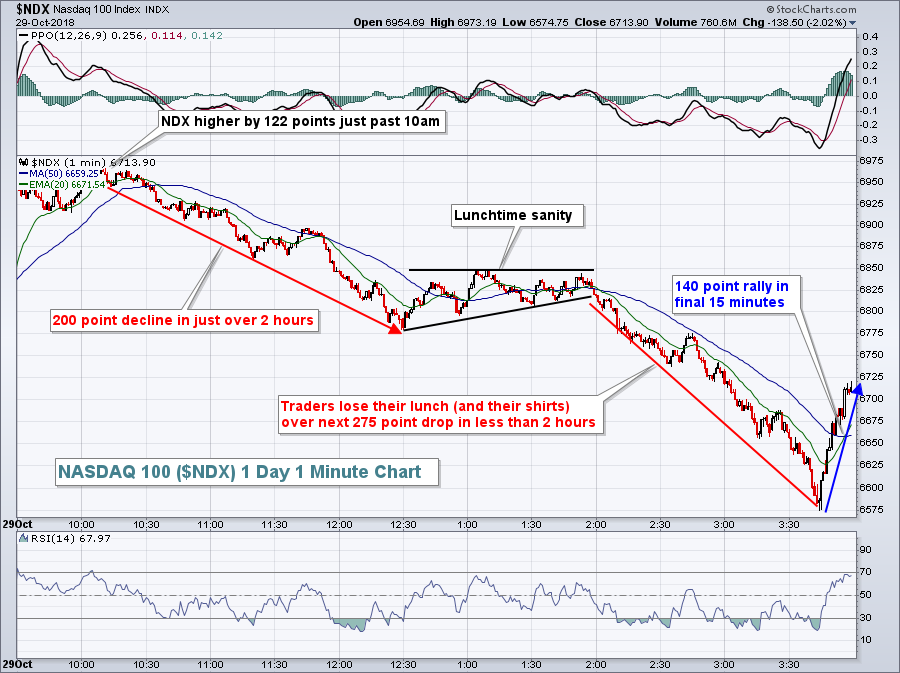
Early on Monday morning, it looked like stocks were trying to carve out a bottom, but by the afternoon, big time selling resumed and prior support levels were lost - all with rapidly rising volatility. That is a recipe for short-term stock market disaster and a roller coaster ride developed into the close. By day's end, all of our major indices were lower, although trading in the final 10-15 minutes recovered a significant amount of losses. It was another extremely volatile session, marked by wild swings in both directions:
 By my count, there were swings of more than 800 points on the NASDAQ 100 ($NDX) during the Monday session. That's roughly 12% of the index value. These moves are literally insane and the high level of volatility ($VXN) is to blame. High volatility equals market insanity. The VXN closed at just under 32, its highest close since the February stock market bottom. Yesterday, I suggested the VXN was marking a bottom and I firmly believe we're at one....or very, very close. The problem is that if you're off by a day or two, it can be extremely costly because these intraday moves are moves that typically take several months to achieve. But not in a panicked market.
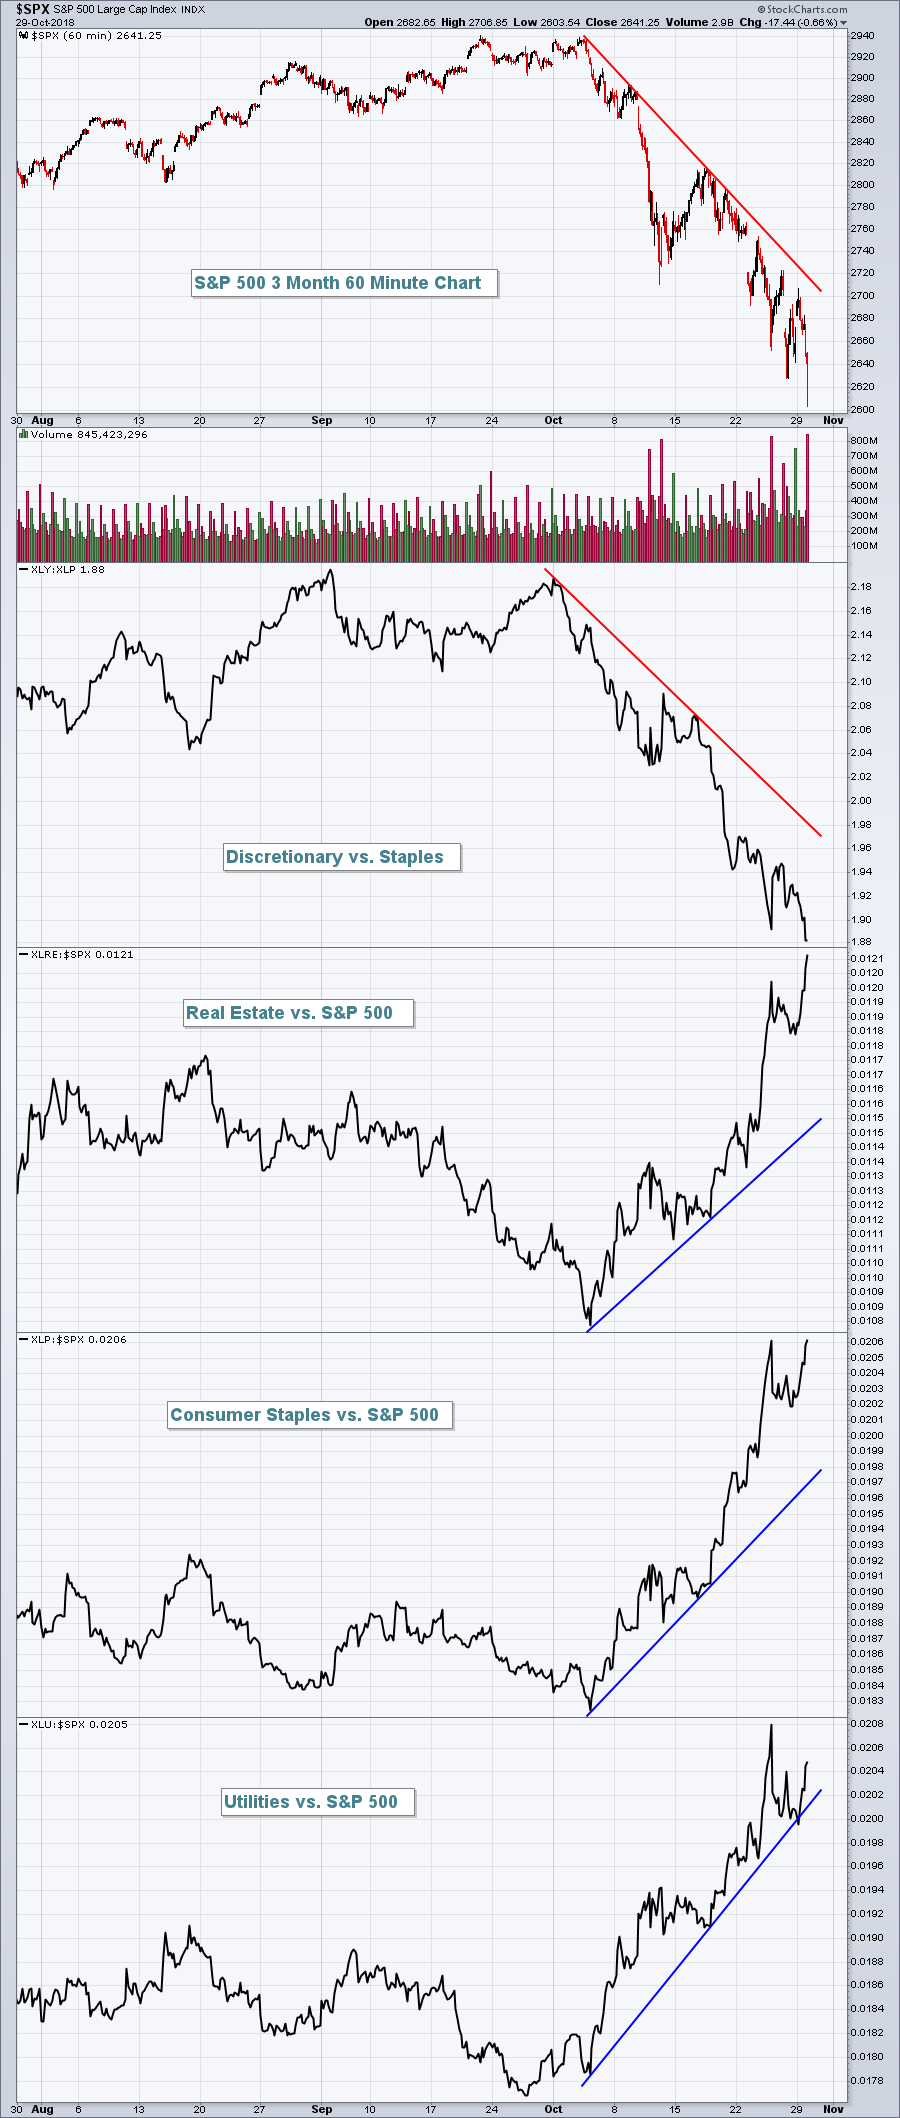
It's difficult to provide a technical wrap on what occurred yesterday because technical analysis really doesn't matter much when panic sets in. The swings are massive and very difficult to predict. But one thing did really stand out to me. The three top performing sectors were real estate (XLRE, +1.65%), utilities (XLU, +1.41%) and consumer staples (XLP, +1.15%) - all defensive groups. Traders continue to flock to safety for now.
On the flip side, the NASDAQ 100 was hurt by several large cap names that have been leaders throughout the bull market. NVIDIA Corp (NVDA, -6.39%), Amazon.com (AMZN, -6.33%), Netflix (NFLX, -5.00%) and Alphabet (GOOGL, -4.52%) were all hit very hard during the afternoon selling on Monday.
Pre-Market Action
The U.S. Dollar Index ($USD) is challenging its August high and is up again this morning, putting a lid on commodities, including both crude oil prices ($WTIC) and gold ($GOLD), which are lower by 1.04% and 0.25%, respectively, this morning. GOLD failed on three attempts to break above $1240 per ounce and lost 0.66% yesterday. Today's weakness could lead to an important short-term support test at the rising 20 day EMA. If you're bullish GOLD, you really want to see that moving average support hold because the longer-term trend is lower.
Asian markets were fairly strong overnight, especially in Tokyo where the Nikkei ($NIKK) gained 1.45%. Europe is mixed this morning after reversing off Monday's intraday highs. Dow futures have been volatile this morning, as you might expect, but currently showing a gain of 86 with roughly 40 minutes left to today's opening bell.
Current Outlook
Here is a reprint of a chart that I provided late last week. It's an important evaluation of risk-on vs. risk-off:
 The trendlines shown above all need to break before the stock market can begin to repair itself.
Sector/Industry Watch
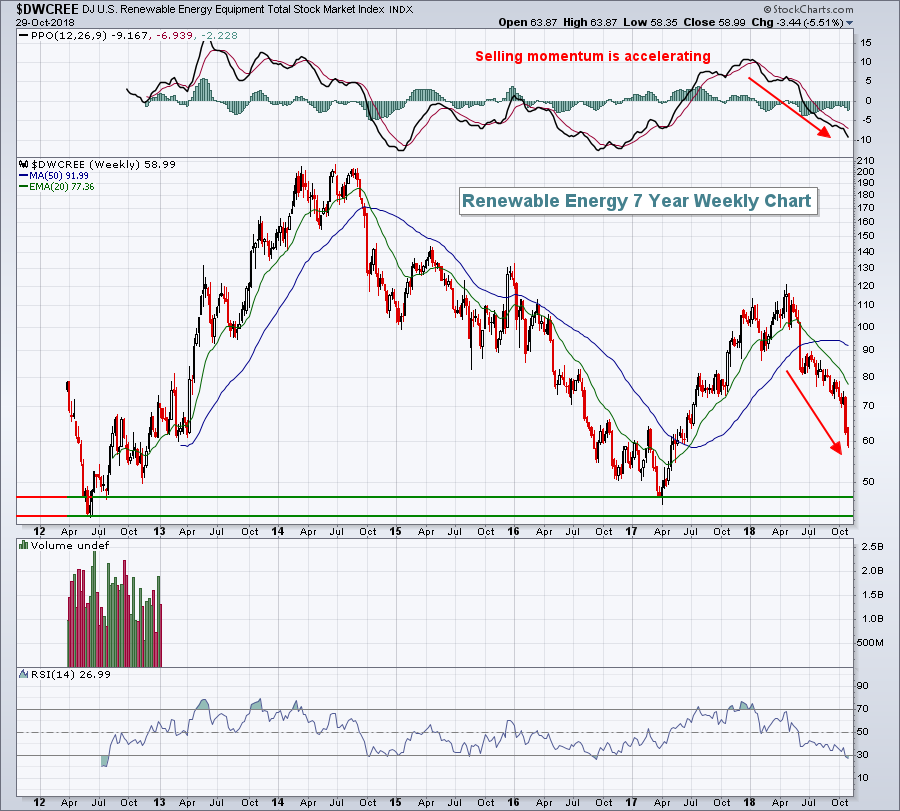
The worst performing group over the past week has been renewable energy ($DWCREE). It's the weakest industry group in the weakest sector (energy). The DWCREE has fallen more than 17% in the last week alone, but that isn't the worst news. Check out the next key support level on the weekly chart:
 The DWCREE is oversold with a weekly RSI now at 27, so a bounce is certainly possible. But this chart sure suggests that we're going to see a test of those support levels from 2017 and 2012. That means we could see another 20% drop to get there.
Historical Tendencies
Since 1971, investing in the NASDAQ has outperformed the S&P 500 by more than 3 percentage points. Here are the average annual returns of each over the past 47 years:
NASDAQ: +11.42%
S&P 500: +8.32%
Key Earnings Reports
(actual vs. estimate):
AET: 2.96 vs 2.84
AGN: 4.25 vs 4.01
AMT: 1.85 vs 1.82
BHGE: .19 vs .21
BP: 1.15 vs .86
CMI: 4.05 vs 3.75
CTSH: 1.19 vs 1.13
ETN: .95 vs 1.44
FIS: 1.33 vs 1.30
GE: .14 vs .21
GPN: 1.44 vs 1.40
HMC: 1.07 vs .79
INCY: .38 vs .40
KO: .58 vs .55
LYB: 2.96 vs 2.73
MA: 1.78 vs 1.68
PEG: .95 vs .92
PFE: .78 vs .76
SNE: 1.20 vs .91
TPR: .48 vs .44
WCG: 3.33 vs 3.08
WELL: 1.04 vs 1.02
XYL: .77 vs .77
(reports after close, estimate provided):
ACGL: .52
AMGN: 3.42
APC: .88
BXP: 1.63
BIDU: 2.57
CHRW: 1.17
CXO: 1.14
EA: .58
EBAY: .55
EIX: 1.31
EXR: 1.19
FB: 1.46
FLT: 2.67
IQ: (.41)
MGM: .18
MKL: 7.61
OKE: .71
PSA: 2.68
TMUS: .85
VRSK: 1.07
YUMC: .44
Key Economic Reports
August Case-Shiller HPI to be released at 9:00am EST: +0.1% (estimate)
October consumer confidence to be released at 10:00am EST: 136.3 (estimate)
Happy trading!
Tom


