Market Recap for Friday, November 23, 2018
Friday's action was disappointing on a couple of different levels. First, the Friday morning attempt at a rally failed midday and sellers emerged into the close. It was somewhat similar to the action on Wednesday when the early morning gap higher and rally gave way to afternoon sellers. Second, the Friday after Thanksigiving has historically had a very bullish slant to it and that really never materialized, except on the small cap Russell 2000, which outperformed and did manage to hang onto a fractional gain to close out the week.
The same theme emerged from Friday. Energy (XLE, -3.14%) was hit hard as crude oil prices ($WTIC, -7.71%) slumped badly. And our aggressive sectors - communication services (XLC, -1.31%), technology (XLK, -0.91%) and financials (XLF, -0.80%) - were once again the target of sellers. Let's be clear about one thing. Corrections do hit the aggressive sectors the hardest, so I'm overly concerned about this action - unless we lose key intermediate-term price support. (See Current Outlook section below for more on that.)
Crude oil prices have sent many areas of energy into a tailspin. None has been worse than oil equipment & services ($DJUSOI), which has been under constant selling pressure:
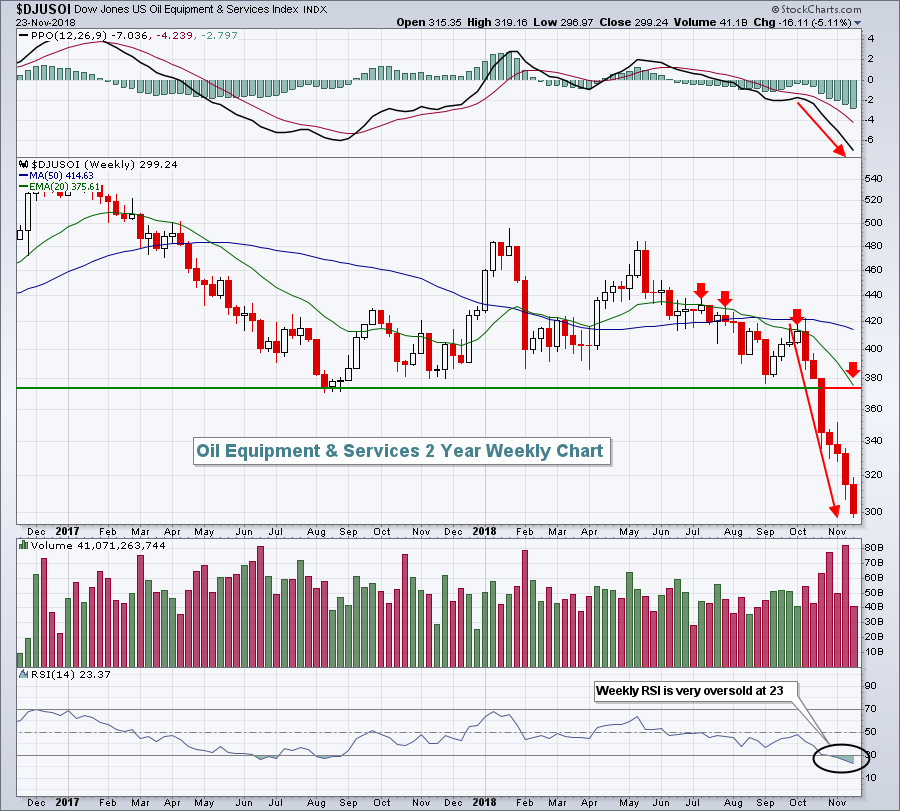 The DJUSOI has lost roughly 30% of its value since early October. That's when crude oil was at $77 per barrel. The selloff in crude has been accelerating and traders are punishing the DJUSOI as a result.
Pre-Market Action
Dow Jones futures are surging this morning, up 238 points with 30 minute left to the opening bell. Crude oil ($WTIC) is bouncing, up 1.65% at last check and rising to $51.25 per barrel. It's very likely just a bounce, but for now the bulls will take it.
Overnight, Asian markets were mixed. However, the Hong Kong Hang Seng Index ($HSI) rose 1.73%, nearing a key price resistance level close to 26500. Breaking above that level would be bullish. In Europe, indices are mostly higher with leadership coming from the German DAX ($DAX), which is up 124 points, or 1.11%.
Current Outlook
Several key ingredients to a bear market remain in place. The Volatility Index ($VIX) is well above the 16-17 support that held during each of the previous two bear markets. The reason to watch this is very simple. Bear markets require a certain level of fear and the VIX is our measure of fear. The second key ingredient just occurred. The S&P 500's weekly PPO just turned negative. You cannot have a bear market with a weekly PPO that's positive. It just can't happen. Here's the latest weekly chart of the S&P 500:
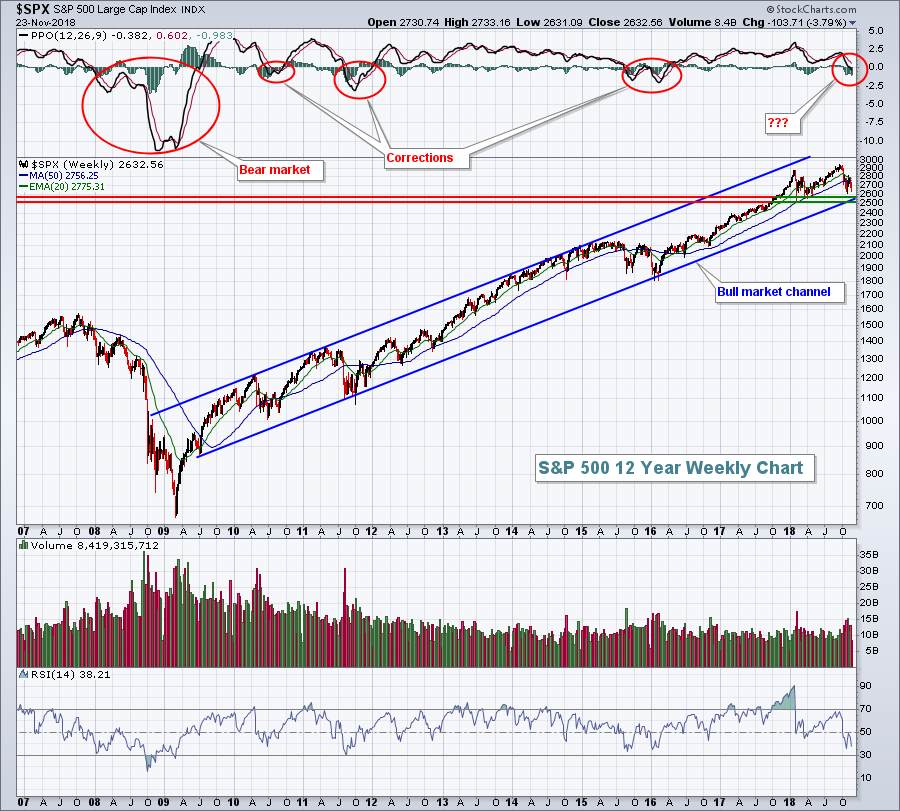 For only the 4th time during this bull market, the weekly PPO has turned negative. The crossover is significant technically, but it's not THE technical sign. We've seen this three times before and each time it was simply a correction. I will not turn bearish until price support is lost. 2582 is the closing price support level to watch and intraday it's 2532.
Sector/Industry Watch
Technology fell more than 6% last week, easily the worst performing sector. Computer hardware ($DJUSCR) dropped an astounding 10% as Apple (AAPL) posted its worst week since April 2016. AAPL had a mostly unabated move higher from late-April 2018 through its recent September high, gaining nearly 50% in the process. It's in the process of giving those gains back as the earlier 2018 lows are now the target of the bears:
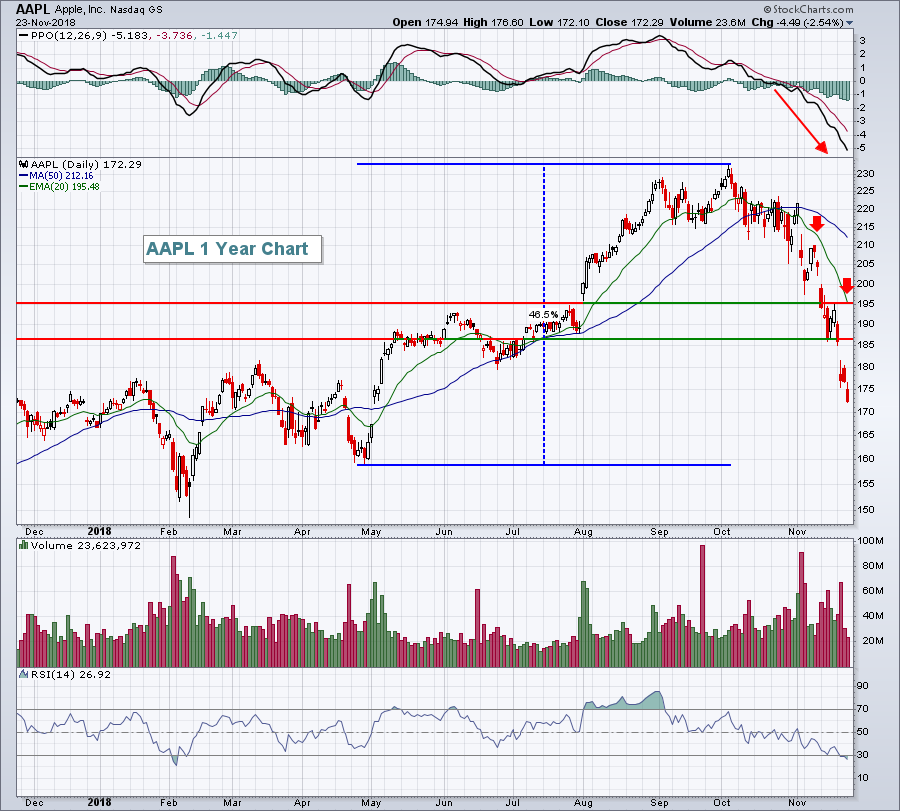 The stock market is oversold and we're in a bullish seasonal period so a bounce here would not be surprising at all. AAPL's key short-term resistance levels are marked above. If the market is bullish near-term, AAPL could easily bounce back to the 185-195 range and still remain in a bearish pattern. The accelerating PPO to the downside makes a price breakout above the declining 20 day EMA unlikely.
Monday Setups
PayPal Holdings, Inc. (PYPL) has had a rough couple weeks, but did recently report excellent quarterly results that topped Wall Street's expectations. PYPL's quarterly revenues and EPS were as follows:
Revenues: $3.68 bil vs. $3.66 bil
EPS: $.58 vs. $.54
Technically, the stock has been a yo-yo, bouncing between price support and resistance:
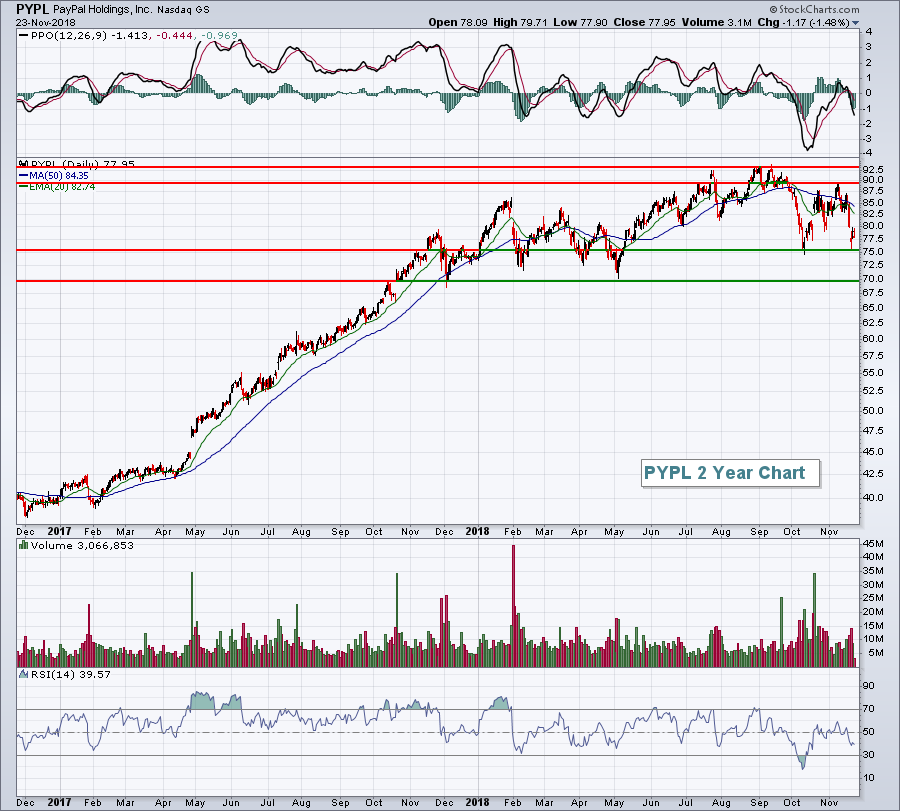 The low- to mid-70s have provided excellent price support, while trips to the low-90s have resulted in sellers emerging. It's a wide trading range, but as PYPL moves lower, the reward to risk on a long position grows significantly.
Historical Tendencies
If small caps drop from current levels, it won't be because of weak historical tendencies. The Russell 2000 is currently in one of its best historical periods of the year (November 23rd through December 6th), which has produced annualized returns of +70.55% since 1987. Furthermore, the month of December has been the best calendar month for small caps in the past three decades.
Key Earnings Reports
None
Key Economic Reports
None
Happy trading!
Tom


