Market Recap for Friday, November 2, 2018
Traders were anxiously awaiting jobs data last week. First, it was a solid ADP employment report on Wednesday morning that helped to lift U.S. equities. But the biggie was on Friday and we all held our collective breath as the numbers were released during pre-market action. It was a very sizable beat vs. consensus estimates and the bond market responded. The 10 year treasury yield ($TNX) surged 7 basis points on Friday and now appears to have printed what could be a neckline in a bullish inverse head & shoulders continuation pattern:
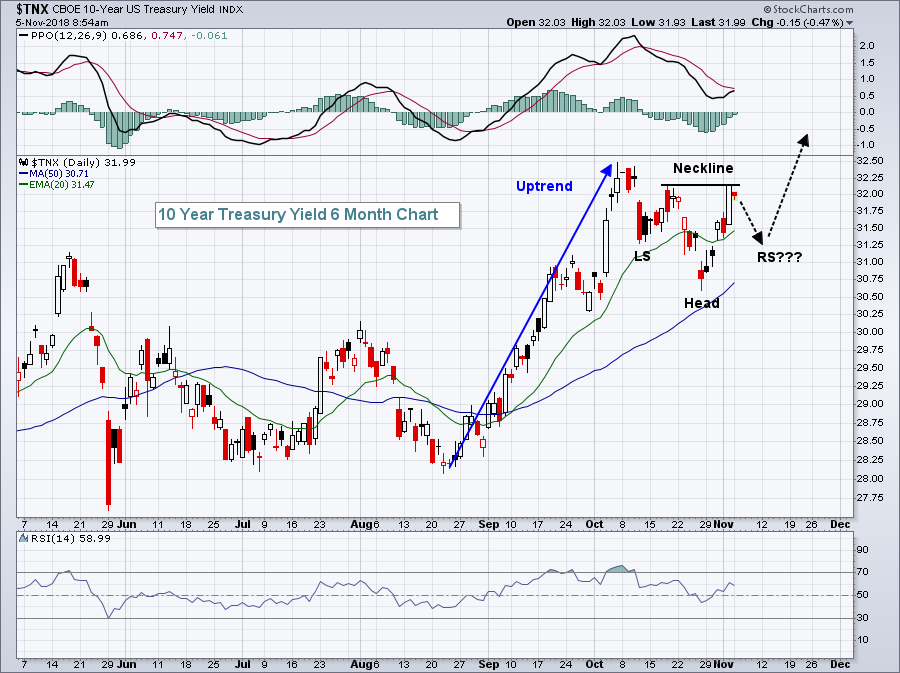 After uptrends, I look for potential continuation patterns as consolidation emerges. The above in no way guarantees we'll see a pull back in the TNX to establish an inverse right shoulder. It's simply something I'd be aware of.
While traders were sellers of treasuries on Friday after the jobs report, some of that money began moving into more aggressive areas of the stock market. Despite an overall lower day on Wall Street (with the Russell 2000 the lone exception posting a 3 point gain), consumer discretionary (XLY, +0.41%) managed to finish the session in positive territory. In addition, financials (XLF, -0.08%) and industrials (XLI, -0.17%) were the next best performing sectors and both are considered more aggressive. When we saw the panicked selling throughout October, defensive groups showed considerable leadership. Friday's composition of sector performance is actually a fairly strong signal that we are not likely to revisit those October lows. Of course, we'll get more evidence this week and go from there. But, at least for a day, selling didn't equate to traders flocking for safety and I find that to be somewhat bullish.
Pre-Market Action
Crude oil ($WTIC) is bouncing slightly this morning after tumbling nearly 20% over the past four weeks. Asian markets kicked off the week in terrible fashion, with the Hong Kong Hang Seng Index ($HSI) falling more than 2% overnight. Europe is fractionally higher this morning as U.S. futures hover close to the flat line. Dow Jones futures are currently lower by 9 points with just under 30 minutes to the opening bell.
Current Outlook
Transportation stocks ($TRAN) are always worth monitoring. They will only do well during a period of economic strength or when the stock market is anticipating economic strength. The Fed keeps telling us that our economy is strengthening and most economic reports, including Friday's nonfarm payrolls, would appear to confirm this. But, for technicians, it still comes down to what the charts are telling us. I believe those February lows are critical, they need to hold. The TRAN was one group that tested those February lows last week, with a bullish bounce thus far. But now we see there's overhead price and moving average resistance. Take a look:
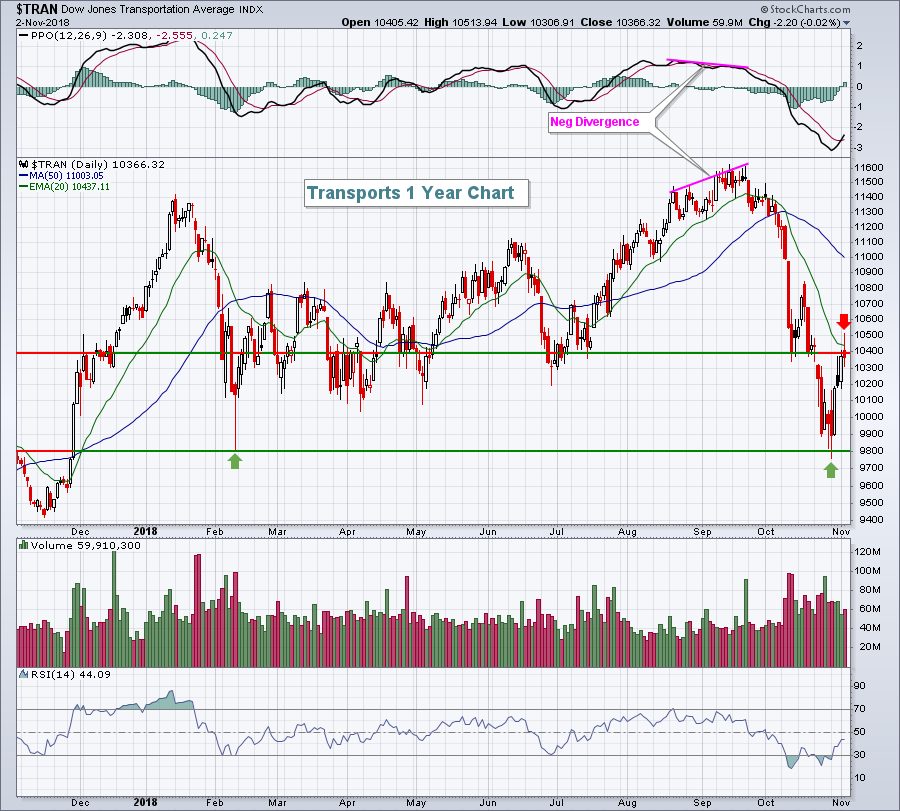 Price resistance is near 10400 and the declining 20 day EMA is currently at 10437. Can we negotiate that resistance and begin to rebuild transports technically? It's a question that might be answered this week. To the downside, the battle line is clearly drawn at 9750-9800 price support.
Sector/Industry Watch
Materials (XLB, +6.10%) was the best weekly performer during last week's bounce, but there's much overhead technical work to do in this space and it's only made more difficult by a rising U.S. Dollar ($USD):
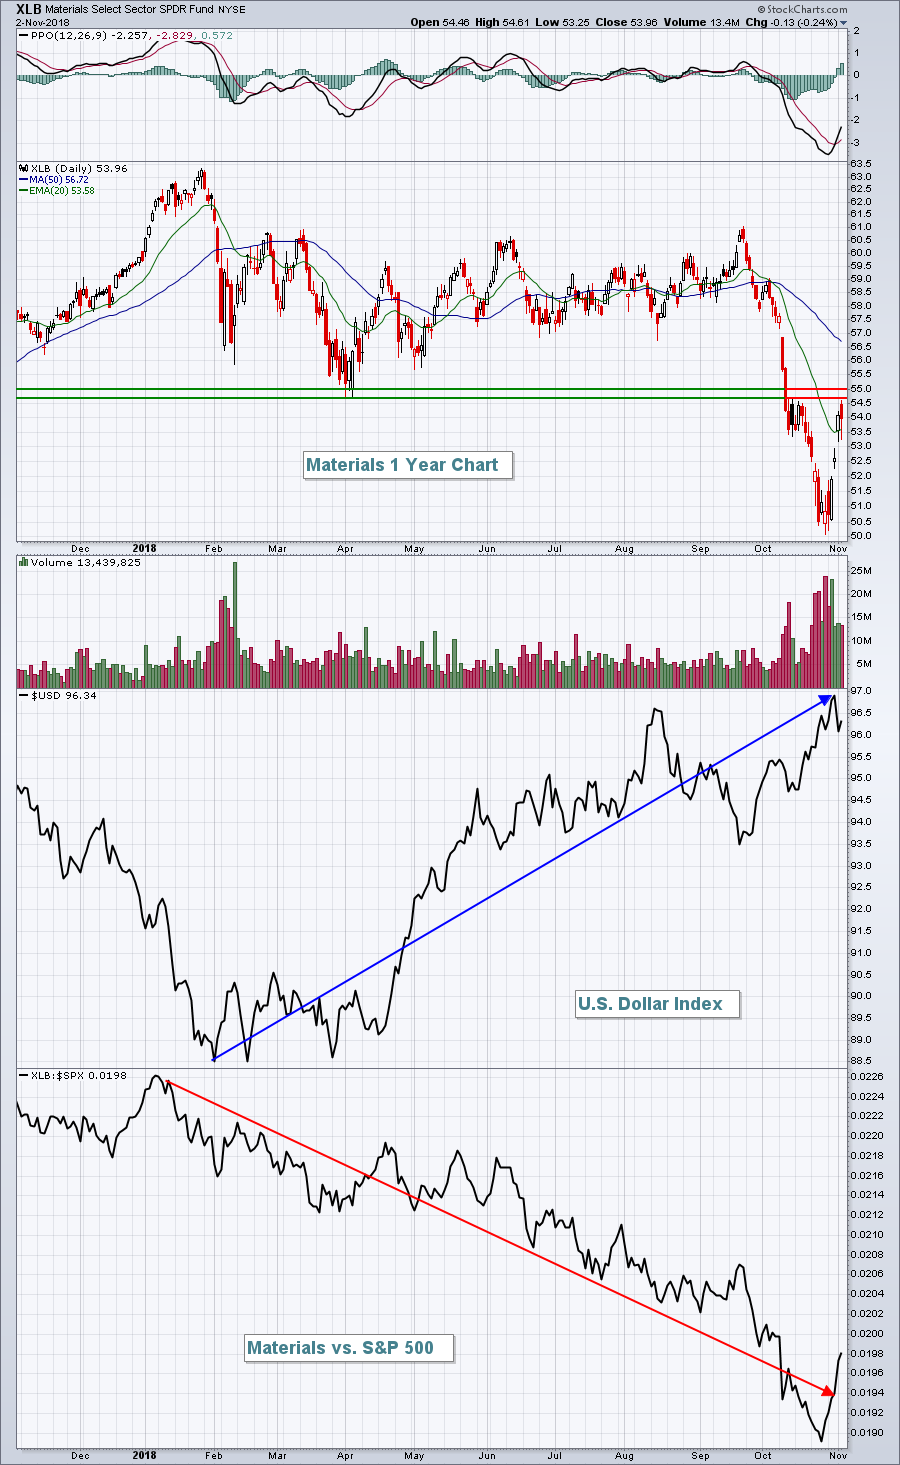 Last week's recovery was nice and much-needed given the very oversold conditions. But I do not like this group at all in a rising dollar environment. Materials helped to lead the 2002-2007 bull market with a falling dollar. But this bull market is totally different with the rising dollar capping the relative performance of materials stocks. 54.50-55.00 should provide short-term price resistance so I'd expect to see relative underperformance from materials this week.
Monday Setups
American Tower Corp (AMT) posted excellent quarterly results last week with it revenues ($1.79 bil vs $1.77 bil) and EPS ($1.85 vs $1.82) both easily topping forecasts. The market reacted positively with AMT spiking from 152.82, its closing price just before its earnings report, to 160.95, which was the next day's close. Profit taking kicked in during the last three days of the week, however, and AMT came back down to test its rising 20 day EMA:
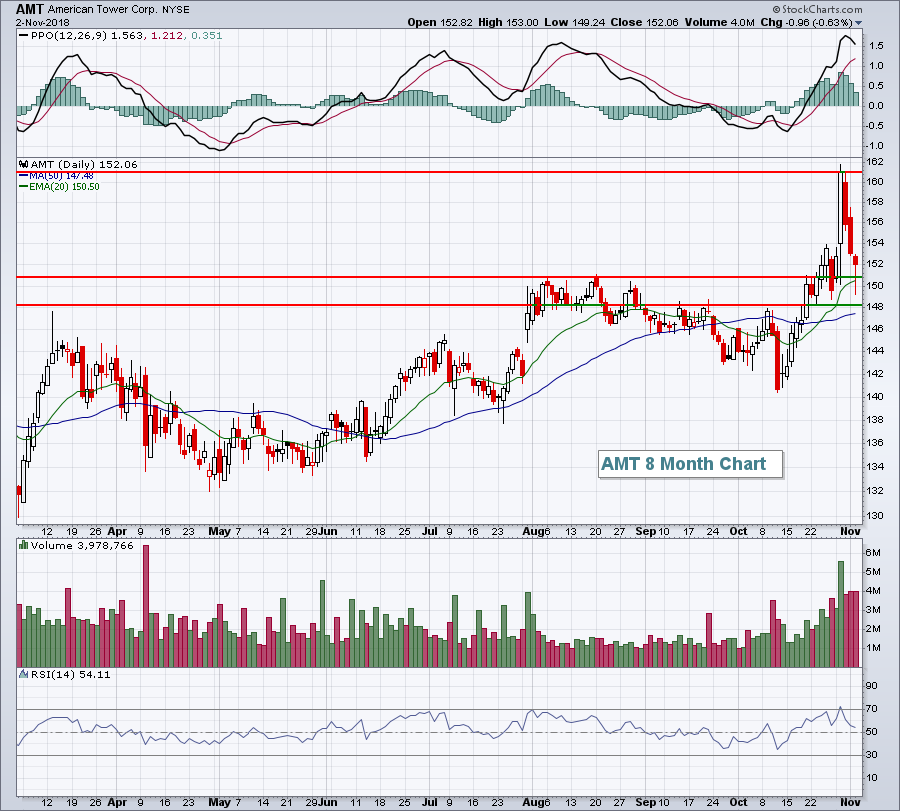 I would look for a reversal on AMT in the 148-151 area and it touched that zone late last week. Keeping a tight stop beneath 148, while looking for a target of 161 provides a solid 2 to 1 reward to risk ratio at AMT's current price and that ratio grows more bullish on any further short-term weakness.
For a look at all of my trade setups for this week, CLICK HERE.
Historical Tendencies
Incyte (INCY) bounced 10% last week after challenging - and successfully defending - 2018 price support just above 60 and INCY printed a reversing hammer in the process. It's noteworthy that key price support held when you consider that INCY has one of the best track records in November (+7.5%) and December (+8.3%) over the last 20 years. Oh....and January's average return over the past two decades? +7.0%. That's an average gain of 22.8% during just three months of the year.
Key Earnings Reports
(actual vs. estimate):
CNA: 1.17 vs 1.13
INVH: .29 vs .29
L: .88 vs .98
OHI: .77 vs .76
PCG: 1.13 vs 1.12
RACE: .90 vs .88
SYY: .91 vs .92
WRK: 1.29 vs 1.24
(reports after close, estimate provided):
ATUS: (.04)
BKNG: 38.37
FMC: .92
FNV: .26
IFF: 1.54
MAR: 1.31
MOS: .64
MYL: 1.17
NBIX: .48
NTR: .41
OXY: 1.51
RNG: .16
SBAC: 1.87
Key Economic Reports
October PMI services index to be released at 9:45am EST: 54.7 (estimate)
October ISM non-manufacturing index to be released at 10:00am EST: 59.4 (estimate)
Happy trading!
Tom


