Market Recap for Wednesday, November 28, 2018
Wall Street finally (!) had a day where the bulls could smile at 4pm EST. It was a trend day where the buying begins early and continues throughout the trading day. These days tend to be very bullish, although there is still plenty to worry about (see Current Outlook and Sector/Industry Watch sections below). Strength could be found everywhere on Wednesday. The NASDAQ and Russell 2000 led the advance with gains of 2.95% and 2.51%, respectively. But Dow Jones components tacked on 2.50% as Verizon Communications (VZ, -0.97%) was the only stock in the index to end the session with a loss. 449 stocks in the S&P 500 advanced, while only 51 declined. The biggest decliners were Tiffany and Co. (TIF, -11.82%) and The JM Smucker Co. (SJM, -7.24%), both as a result of poor quarterly earnings and/or forward guidance. By and large, stocks gained ground yesterday.
It was also a "risk on" type of advance, the best kind for the bulls. Aggressive sectors led the charge as technology (XLK, +3.50%) and consumer discretionary (XLY, +2.95%) were leaders throughout the day. Most of the gains came after Federal Reserve Chairman Jerome Powell indicated in a noon EST speech that we are very close to "neutral" in terms of interest rate policy. That was a far cry from where the Fed Chair was just weeks ago and the buyers returned. The XLK stormed through overhead 20 day EMA resistance, but there's plenty of technical work left on the daily chart:
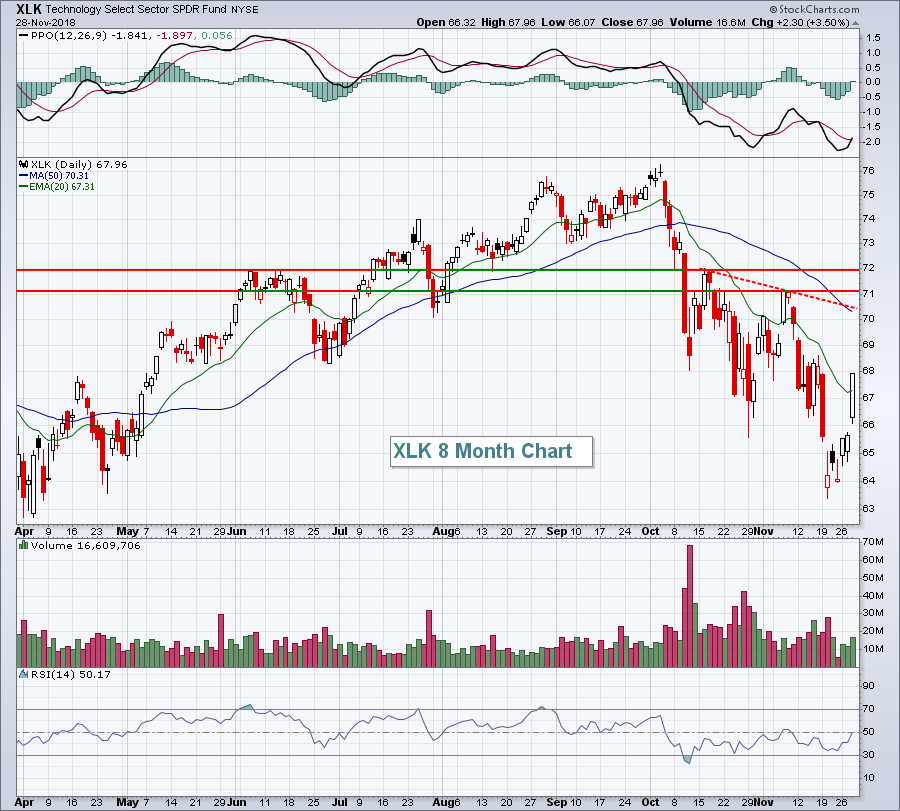 I see three overhead concerns:
1. The downtrend line established from the past two reaction price highs (red dotted line).
2. The falling 50 day SMA, currently at 70.31.
3. The price resistance zone (71-72) established from the past two highs.
Furthermore, the XLK weekly chart is perhaps even more problematic:
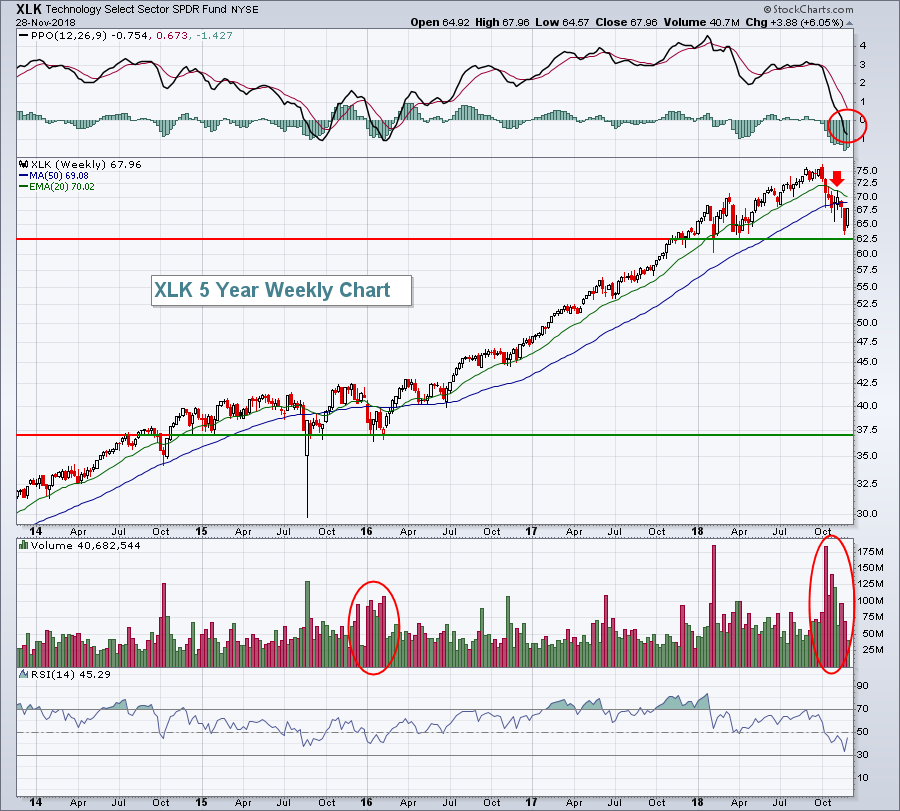 Listen, I loved the action yesterday and I'm not trying to downplay a key day of bullishness. Instead, I'm just trying to keep it real. Corrective sideways action has periodic bullish days. Bear markets have oversold rallies. Yesterday was great, but it isn't a game changer. We cannot ignore the recent heavy selling moving average breakdown. We cannot ignore the weekly PPO turning negative as that's a necessary ingredient (although not a determining one) of a bear market. Simply put, we must still remain cautious.
Notable areas of strength yesterday included broadline retailers ($DJUSRB, +5.20%), software ($DJUSSW, +4.30%) and financial administration ($DJUSFA, +3.66%). These were all leaders throughout the past couple years and the oversold bounce represented welcome relief.
Pre-Market Action
Gold ($GOLD) benefited yesterday from the Fed Chair's comments as the initial effect was a falling dollar ($USD), sending traders back into GOLD on a short-term basis. This morning, GOLD is trading at $1225 per ounce. Key price resistance resides near $1240 per ounce.
Crude oil ($WTIC) is bouncing this morning and currently trades at $51 per barrel, up roughly 1.50%.
Asian markets were mixed overnight, while European markets are higher, likely playing "catch up" with the big afternoon gains here in the U.S. With less than 20 minutes to the opening bell on Wall Street, Dow Jones futures are lower by 21 points.
Current Outlook
I remain cautiously bullish and I'm trading on the long side, but we are nowhere near being out of the woods. It was one really good day, nothing more. Our major indices were at or very near critical price support levels, exactly where we'd expect a bounce. Traders received an emotional lift from Fed Chairman Powell's remarks yesterday that we are very close to "neutral" on interest rates. In October, the Fed Chair indicated that we were far from neutral, which suggested several more rate hikes. Yesterday's speech at least provided a pause to all the interest rate hike talk. In the end, we want more interest rate hikes! If you need proof, look at this chart:
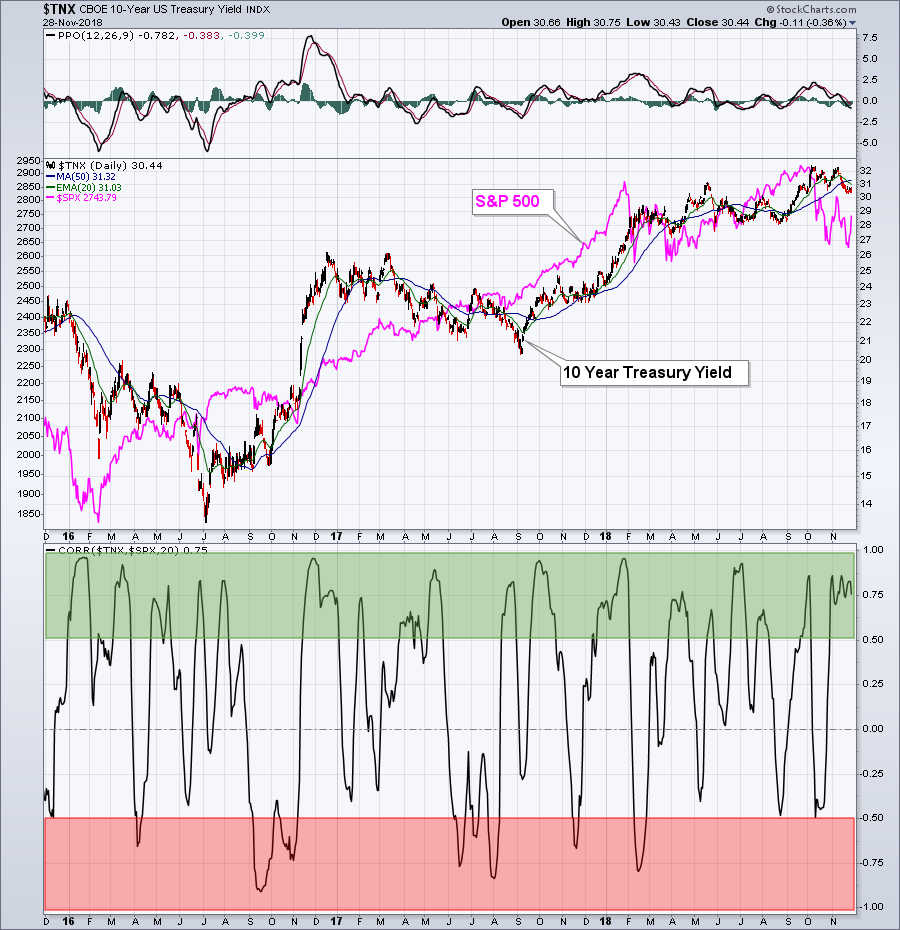 Since the 10 year treasury yield ($TNX) bottomed in July 2016 at 1.40%, it's risen to a recent high of 3.25%. The S&P 500 has risen more than 50% since its low in February 2016. The stock market loves interest rate increases for two reasons. First, rising interest rates means falling treasury prices. The proceeds from those treasury sales generally find its way into equities, lifting our major indices. That's the money rotation impact. Then there's the economic reason for the selling. Interest rates typically move higher as our economy expands or in anticipation of our economy expanding. That's the reason for owning equities as opposed to owning treasuries. Is there a level of interest rates where they become counter productive? Of course, but 3% is not that level - at least according to history....or common sense for that matter.
Listen, I heard the Fed Chairman loud and clear. What he said somewhat contradicted what he said just a little more than a month ago. That, in my opinion, is the problem in the market right now. There's too much indecision and we need clarity. Falling treasury yields since that early October high suggest there's a lot of defensive money rotating into treasuries. Falling crude oil prices ($WTIC) suggest that global demand is weak and likely to remain that way for the foreseeable future. In the chart above, I showed the mostly positive correlation between the TNX and SPX. There's also a long-term mostly positive correlation between the WTIC and SPX and the WTIC has fallen apart over the past two months. Despite all of the emotional trading the past two months, both higher and lower, we need to continue to look at the market action - and underlying defensive market rotation - objectively.
We are not out of the woods, despite any short-term oversold bounce.
Sector/Industry Watch
Next up is the Volatility Index ($VIX). Be honest, did you notice that the VIX fell just 2.79% on one of the strongest days of 2018? Think about what has been happening to the VIX on days where impulsive selling kicks in. We've seen huge spikes. The VIX is a big part of the problem right now. A VIX above 16-17 is our signal that the market is on edge. The bear markets of 2000-2002 and 2007-2009 never saw a VIX drop below 16. Not on any rally during the entirety of the downtrend. Fear is a necessary ingredient for a bear market. Check out this VIX chart for the past year:
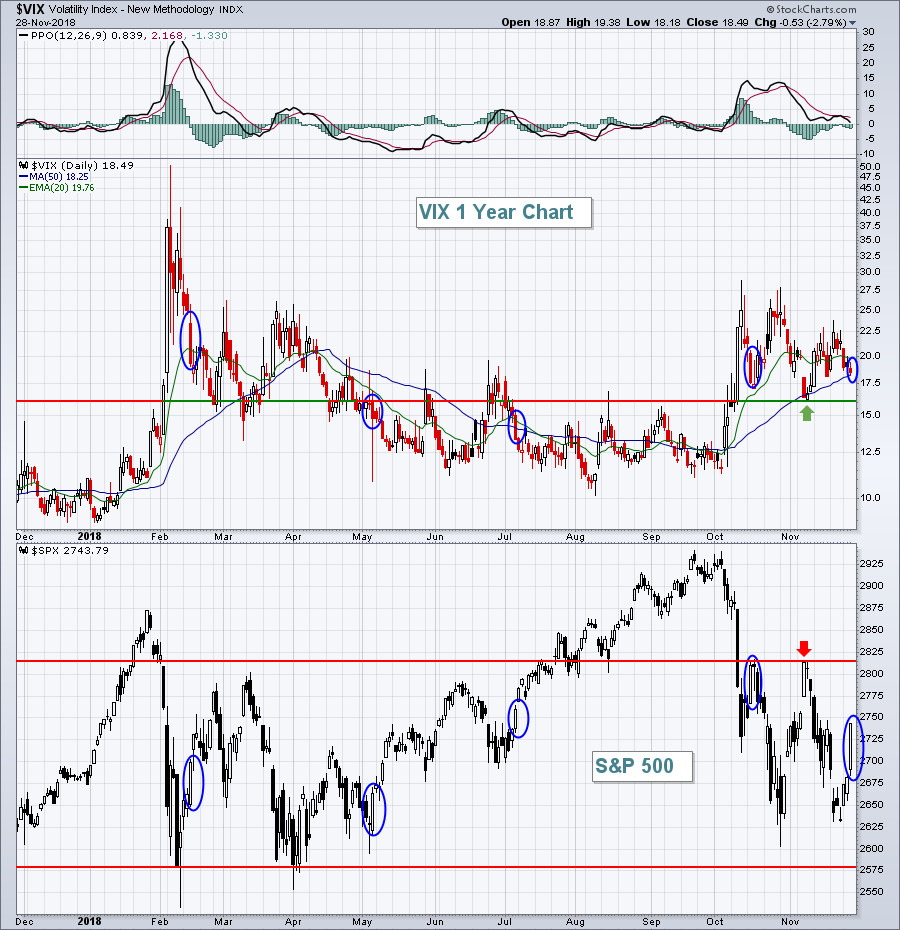 The blue circles above highlight several of the biggest S&P 500 spikes off of price lows and it seems fairly obvious to me that they all saw much larger drops in the VIX than yesterday's S&P 500 surge. It is meaningful? I'm not sure, but I think it's noteworthy. There was buying everywhere. All. Day. Long. And the VIX drops just 2.79%? Hhhmmmm. I haven't turned bearish. I always give the bulls the benefit of the doubt in a bull market until major price support is lost and that level is 2582 on the S&P 500 on a closing basis.
While CNBC parades its "experts" (aka cheerleaders) to argue their bullish or bearish positions, I'll continue to simply monitor all the massive technical, sentiment and historical information we have at our disposal here at StockCharts.com to give you my unbiased opinion. Yes, I am mostly bullish and argue with a bullish slant, but at last check the S&P 500 had fallen more than 1% only one year since 2002 (2008 dropped 38.49%). Those who repeatedly call for bear markets every time the stock market corrects are a dime a dozen and are not much better than a broken clock.
Historical Tendencies
Since 1950, here is a breakdown on S&P 500 calendar year performance (68 years in sample):
Years with positive returns > 20%: 18
Years with positive returns 10-20%: 18
Years with positive returns 0-10%: 15
Years with negative returns < 10%: 6
Years with negative returns 10-20%: 8
Years with negative returns > 20%: 3 (1974, 2002, 2008)
Summary:
51 of 68 years have ended higher (75%)
18 of 68 years have gained > 20% (26%)
3 of 68 years have fallen > 20% (4%)
Many investors lose out on tons of return in the stock market because they fear those -20% years. There've been 3 in my lifetime. Why would anyone have a mostly negative slant? How can that be profitable long-term?
Think about it.
Key Earnings Reports
(actual vs. estimate):
CM: 2.30 vs 2.27
DLTR: 1.18 vs 1.15
TD: 1.25 vs 1.23
(reports after close, estimate provided):
HPQ: .54
PANW: 1.05
PVH: 3.14
SPLK: .31
VMW: 1.50
WDAY: .15
Key Economic Reports
Initial jobless claims released at 8:30am EST: 234,000 (actual) vs 220,000 (estimate)
October personal income released at 8:30am EST: +0.5% (actual) vs. +0.4% (estimate)
October personal spending released at 8:30am EST: +0.6% (actual) vs. +0.4% (estimate)
October pending home sales to be released at 10:00am EST: +0.0% (estimate)
FOMC minutes to be released at 2:00pm EST
Happy trading!
Tom


