Market Recap for Wednesday, December 19, 2018
This was a Fed day that could have lasting damaging effects. Fed Chair Jerome Powell and his band of cronies decided to ignore the one piece of data that's probably the best leading indicator - the U.S. stock market. The stock market has been telling everyone, except apparently the Fed, that economic growth is slowing. Despite these signals, the Fed announced its course of higher interest rates will continue. They hiked the fed funds rate another 25 basis points yesterday, which most traders expected. However, their language regarding 2019 really didn't change that much, moving from the potential of three rate hikes to two. That hawkish tone came at a time (2pm EST) when the Dow Jones was trading at 24050. Major intermediate-term price support was roughly 23500, established at its March low. In one hour, the Dow Jones fell nearly 900 points. 900 POINTS!!!! Hello, Fed.....anybody home??? Price action tells us a story and yesterday's was a horror story.
Let's look at the sectors hurt the most yesterday:
Communication services (XLC): -2.14%
Consumer discretionary (XLY): -1.98%
Technology (XLK): -1.98%
Industrials (XLI): -1.89%
At first glance, you might think that's not so bad. But consider that at 2pm EST, the consumer discretionary group was at 102.33, which was higher by approximately 1.8% on the session. After the Fed's incredulous remarks, the XLY hit 97.97 by 3pm EST. That's more than 4% in one hour. And let's not forget that stocks were already under considerable selling pressure in December. It simply got worse. Surprisingly, the XLY remains one of the few areas where we've yet to see a technical breakdown beneath earlier 2018 lows:
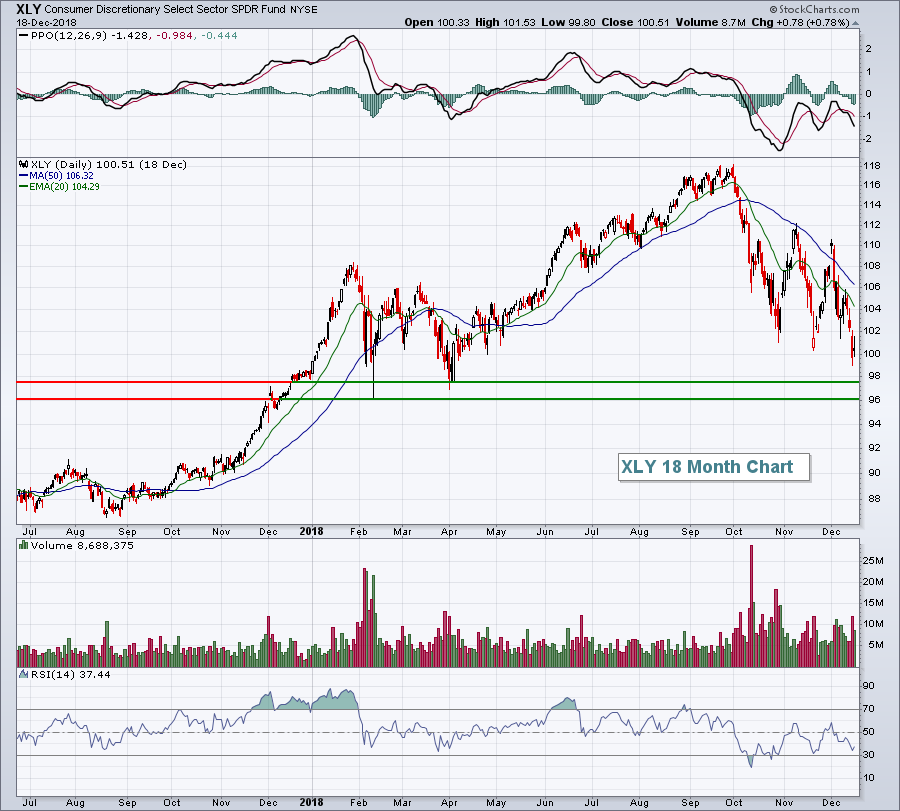 It would certainly seem like it's just a matter of time before the XLY breakdown occurs. All of our major indices have now broken down. While we can never be 100% certain that we're in a bear market, the majority of signals clearly point to one.
I am firmly in the camp of the U.S. being in a "secular" (long-term) bull market. But secular bull markets have cyclical bear markets and that's what I believe lies ahead. We should all brace for lower prices in 2019. I'll be providing charts in the days and weeks ahead where we should look for short-term and long-term price support, but my trading strategy has changed with price breakdowns in our major indices. This establishes a new pattern of lower highs and lower lows. Timing the bear market highs will be of utmost importance as we move forward. They will provide exit opportunities for longer-term portfolios before the next leg down.
Pre-Market Action
Gold ($GOLD) is trading above $1260 per ounce this morning and should be a primary beneficiary of the U.S. stock market breakdown. Crude oil ($WTIC)? Not so much. WTIC is down approximately 3% this morning to $46.74 per barrel and lower demand ahead will not help "black gold".
Tokyo's Nikkei ($NIKK) fell nearly 600 points overnight, or 2.84%, to lead Asian markets mostly lower. European markets are being slammed currently, with the German DAX ($DAX) down another 158 points, or 1.47%.
Dow Jones futures are lower by 63 points as we approach the opening bell. We're very oversold and could use a short-term bounce, but a Volatility Index ($VIX) in the mid-20s tell us that anything is possible today. Caution is the word.
Current Outlook
Did the Fed look at this chart while contemplating the future outlook of the U.S. economy?
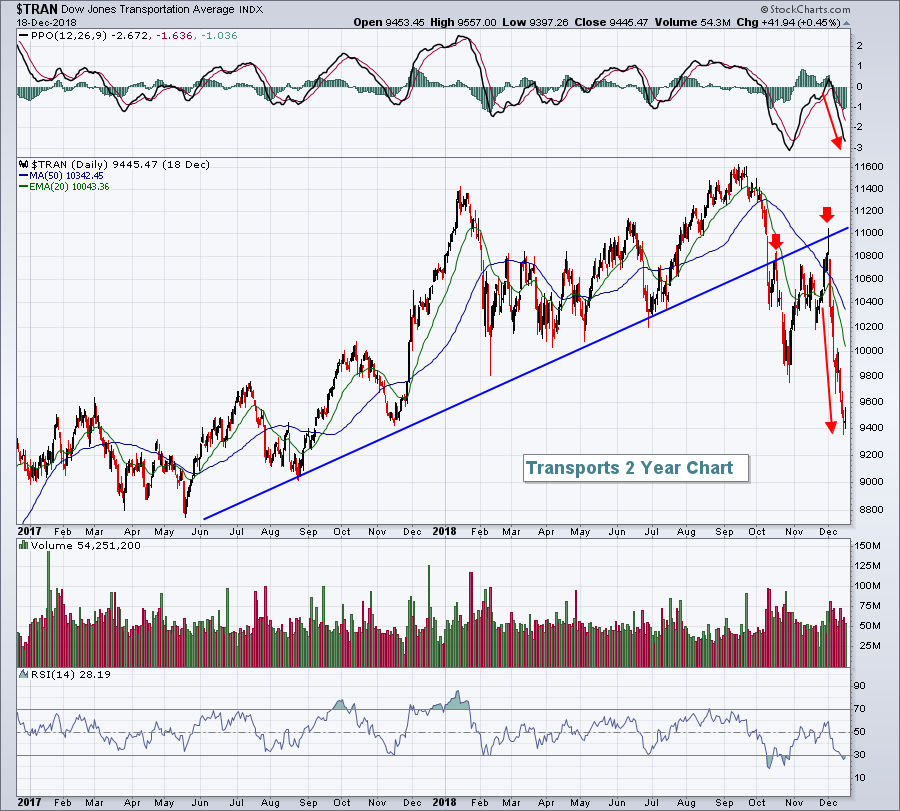 The character of the economically-sensitive transports' chart clearly has changed in Q4. We were humming along until September (as was just about every area of the U.S. stock market). Since then, U.S. stocks have begun to price in considerable slowing of our economy in 2019. Is it a likely recession? It's way too early to make that call, but it's fairly obvious that transports are seeing a weakening ahead. Why can't the Fed see it? Two more rate hikes? Traders have been placing their bets on economic weakness ahead and the Fed essentially is guaranteeing it with their policy.
Sector/Industry Watch
Banks ($DJUSBK) were already challenged technically heading into December, but this has been a December to remember (or forget if you're long). The Fed isn't helping. Rising short-term rates (fed funds) and declining long-term rates ($TNX) are putting a major squeeze on banks and it's showing:
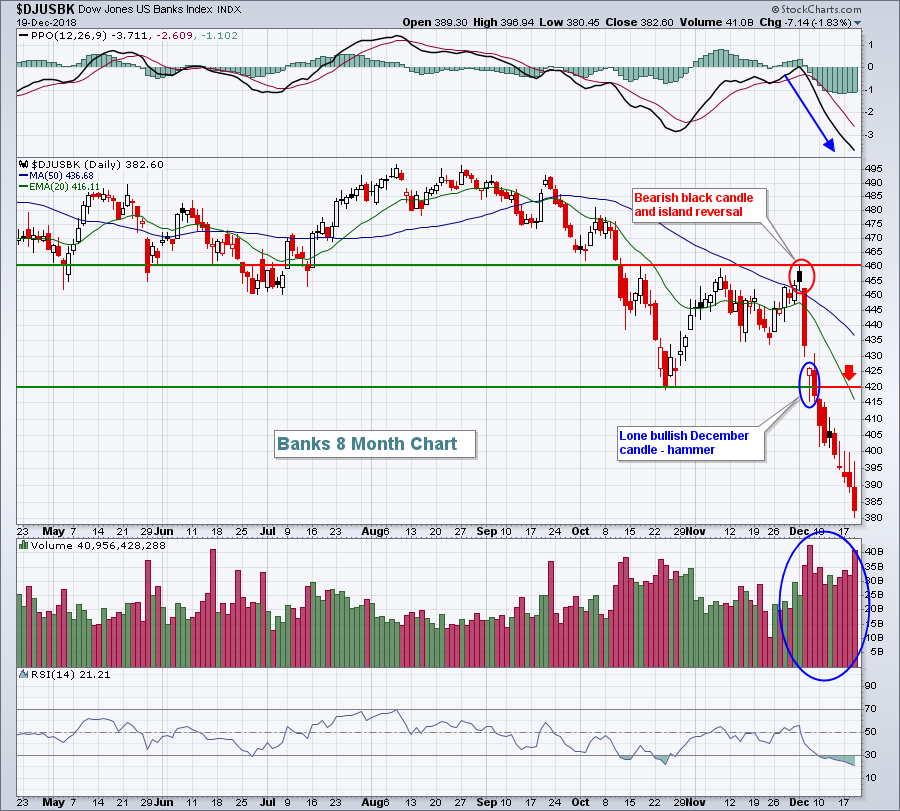 Through December 19th, there's one single bullish December candle on this chart - the hammer that temporarily held October price support. Other than that, look at those candles. Nearly every one has a close near its intraday price low. The last four days all show long tails to the upside, reflecting early attempts at recovery, followed by heavy selling into each close. Then check out the volume. Traders cannot exit banks fast enough. Poor performing banks result in less credit availability and our economic growth is highly-dependent on that. It's difficult finding a silver lining in any of the S&P 500's Q4 misery.
Historical Tendencies
Hasbro, Inc (HAS) has a history of swimming against the bullish December tide. Of course, there's been no bullish December tide this year so far. Given the overall weak environment for equities, HAS has moved violently lower, dropping from a close above 96 on November 29th to yesterday's close of 80.50. This is continuing the weak historical performance for HAS as the stock has risen only 25% of Decembers in the past two decades. By contrast, the S&P 500 has risen 70% of Decembers since 1998.
Key Earnings Reports
(actual vs. estimate):
ACN: 1.96 vs 1.84
CAG: .67 vs .55
CCL: .69 (estimate, awaiting results)
WBA: 1.46 vs 1.43
(reports after close, estimate provided):
CTAS: 1.72
NKE: .45
Key Economic Reports
Initial jobless claims released at 8:30am EST: 214,000 (actual) vs. 220,000 (estimate)
December Philadelphia Fed survey released at 8:30am EST: 9.4 (actual) vs. 16.5 (estimate)
November leading indicators to be released at 10:00am EST: +0.0% (estimate)
Happy trading!
Tom


