Market Recap for Friday, December 14, 2018
The U.S. stock market suffered another big blow to its current 9+ year bull market on Friday. Culprits for the selling included Johnson & Johnson (JNJ, -10.30%) in the healthcare space (XLV, -3.37%), easily the worst performing sector, Adobe Systems (ADBE, -6.96%) in technology (XLK, -2.45%) after missing its bottom line EPS estimate ($1.83 vs $1.88) and Costco (COST, -8.50%) missing its earnings estimate ($1.61 vs $1.62) to lead consumer discretionary (XLY, -1.66%) and broadline retailers ($DJUSRB, -3.33%) lower. It was simply another very poor performance for equities as money again rotated toward the defensive treasury market.
There were two sectors that avoided the carnage. The defensive real estate (XLRE, -0.18%) and utilities (XLU, -0.19%) performed very well on a relative basis and that tends to be the case during periods of market selling and volatility. Should the selling in the S&P 500 continue in the second half of December, I'd fully expect to see further relative strength in these two areas, along with consumer staples (XLP) and healthcare.
The absolute strength in real estate has been obvious as well:
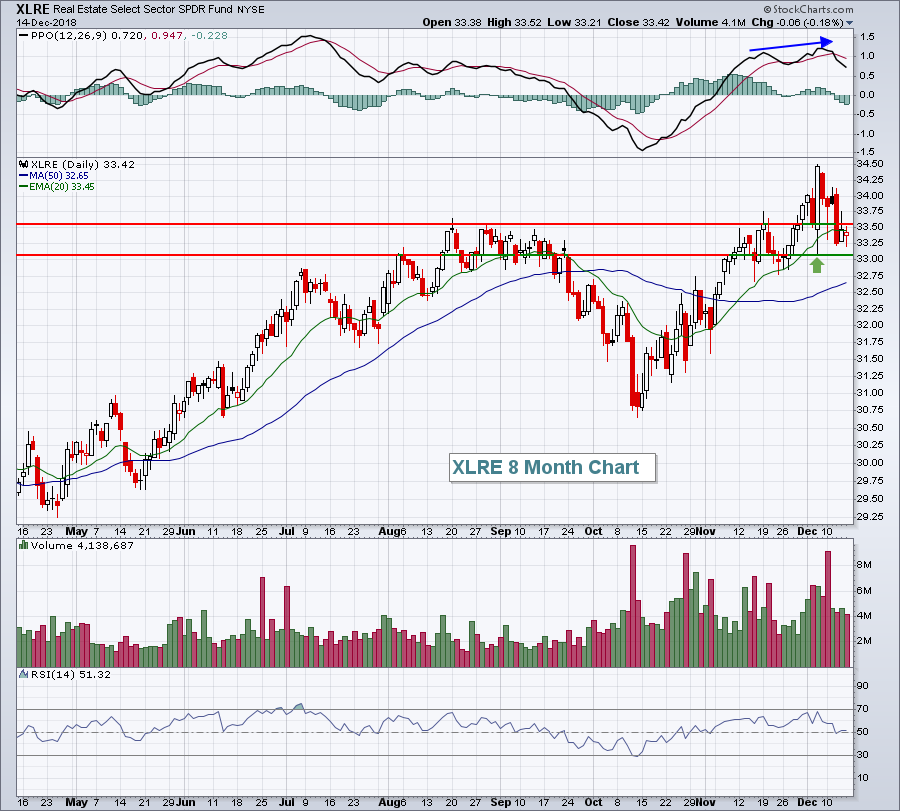 The PPO was rising and at a new recent high on XLRE's latest price high, a signal of accelerating bullish price momentum. The reaction price low, after the last high was established, is roughly 33.05. Technically, I'd like to see that level hold and the XLRE push to new highs.
Pre-Market Action
The U.S. Dollar Index ($USD) has come under pressure this morning and crude oil ($WTIC) continues to hover just above $51 per barrel. Gold ($GOLD), a likely candidate to benefit if the triple top in the USD is confirmed, is higher by $3 per ounce to $1244.
European markets are struggling this morning, while most Asian markets ended higher overnight. Here in the U.S., Dow Jones futures are pointing to a lower open, currently down 126 points just minutes from the opening bell.
Current Outlook
A number of key areas have lost February 2018 price support with new lows being set or approached on Friday, including transports ($TRAN), small caps ($RUT), banks ($DJUSBK), semiconductors ($DJUSSC), crude oil ($WTIC), etc. These are all signs that our economy, at a minimum, is slowing. It could signal something much worse and S&P 500 price action from here will provide us those answers. Our benchmark S&P 500 is residing exactly where we were in February 2016 (correction) and January 2008 (bear market) - not in terms of the S&P 500 value, but rather in terms of testing MAJOR price support established from earlier, high-volatility, price lows. The former was a great buying opportunity and the latter turned out to be the start of one of the worst bear markets in our history. The former held price support and the latter didn't. The following is a short-term look at the S&P 500 hourly chart, but let's remain focused on the bigger picture and 2581 closing price support:
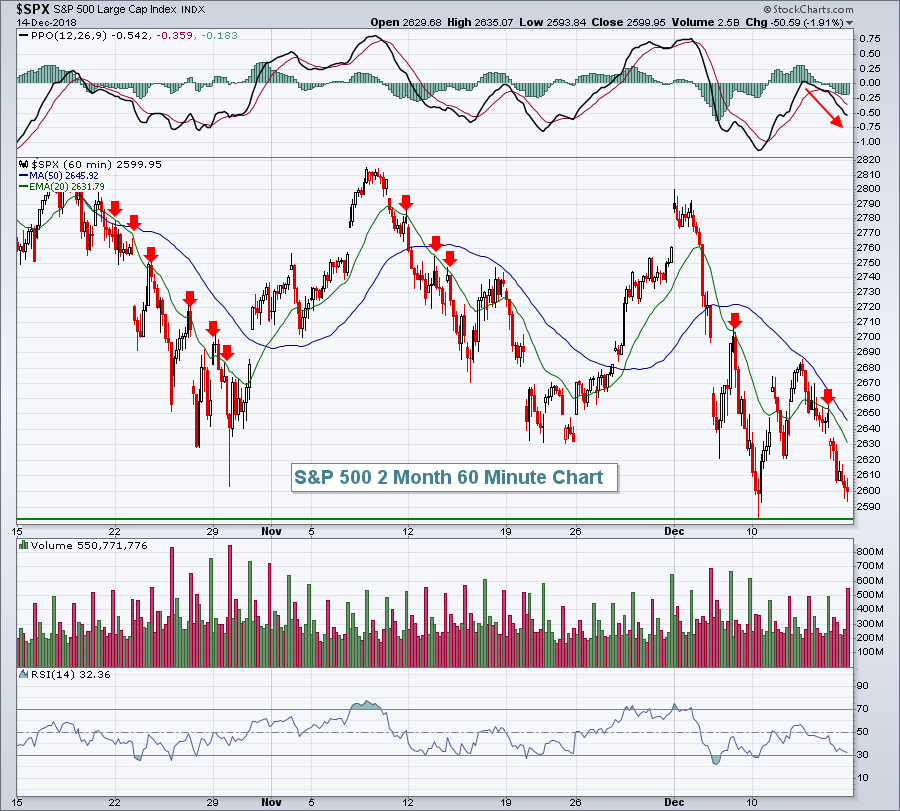 The green horizontal line highlights the key closing price support of 2581. The S&P 500 hit an intraday low last week of 2583, establishing very strong price support there. Those who follow intraday lows as price support have a bit more room down to 2532.69. At that February 2016 low, it could be argued that we closed beneath the initial closing low, and we did by a small margin and very briefly. I don't want to split hairs. Let's just say the S&P 500 support "range" is in that 2532-2581 area. Believe me, if we break down, I doubt we'll be trying to figure out whether it's a definitive breakdown. It'll likely be one of those powerful, down thrusts accompanied by extreme volatility.
Sector/Industry Watch
Healthcare (XLV) looked to be setting up nicely in a bullish ascending triangle last week (black dotted uptrend line below)....until it was reported that Johnson & Johnson was aware that asbestos was present in baby powder. Then look what happened:
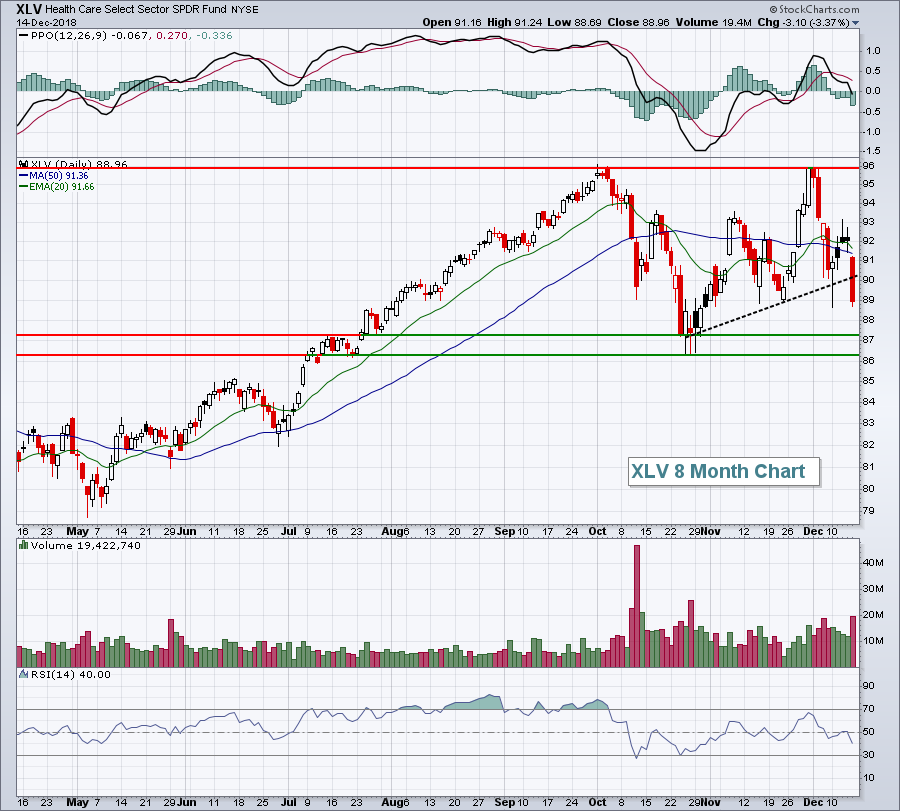 Volume was heavy on Friday as the XLV now simply appears set to trade in sideways consolidating fashion with key support in the 86.25-87.25 zone.
Monday Setups
I will discuss Monday Setups during today's MarketWatchers LIVE show, but I want to see where the market stands after a couple hours trading this morning before providing individual stocks. We're currently trading just above key price support on the S&P 500, supporting long trades. However, many "beneath the surface signals" have turned quite bearish, so if the S&P 500 loses price support, please be sure to keep your intraday stops in place.
Historical Tendencies
If the S&P 500 breaks down beneath key price support at 2582, it will have to do so during a historically bullish period. December has been the best calendar month of the year for the S&P 500 since 1950 and the second half of December is where we easily see the most strength. Here's a breakdown of S&P 500 December annualized performance over the last seven decades:
December 1-15: +2.91%
December 16-31: +37.36%
Key Earnings Reports
(reports after close, estimate provided):
HEI: .49
ORCL: .78
RHT: .87
Key Economic Reports
December empire state manufacturing survey released at 8:30am EST: 10.9 (actual) vs. 21.0 (estimate)
December housing market index to be released at 10:00am EST: 61 (estimate)
Happy trading!
Tom


