Market Recap for Wednesday, January 9, 2019
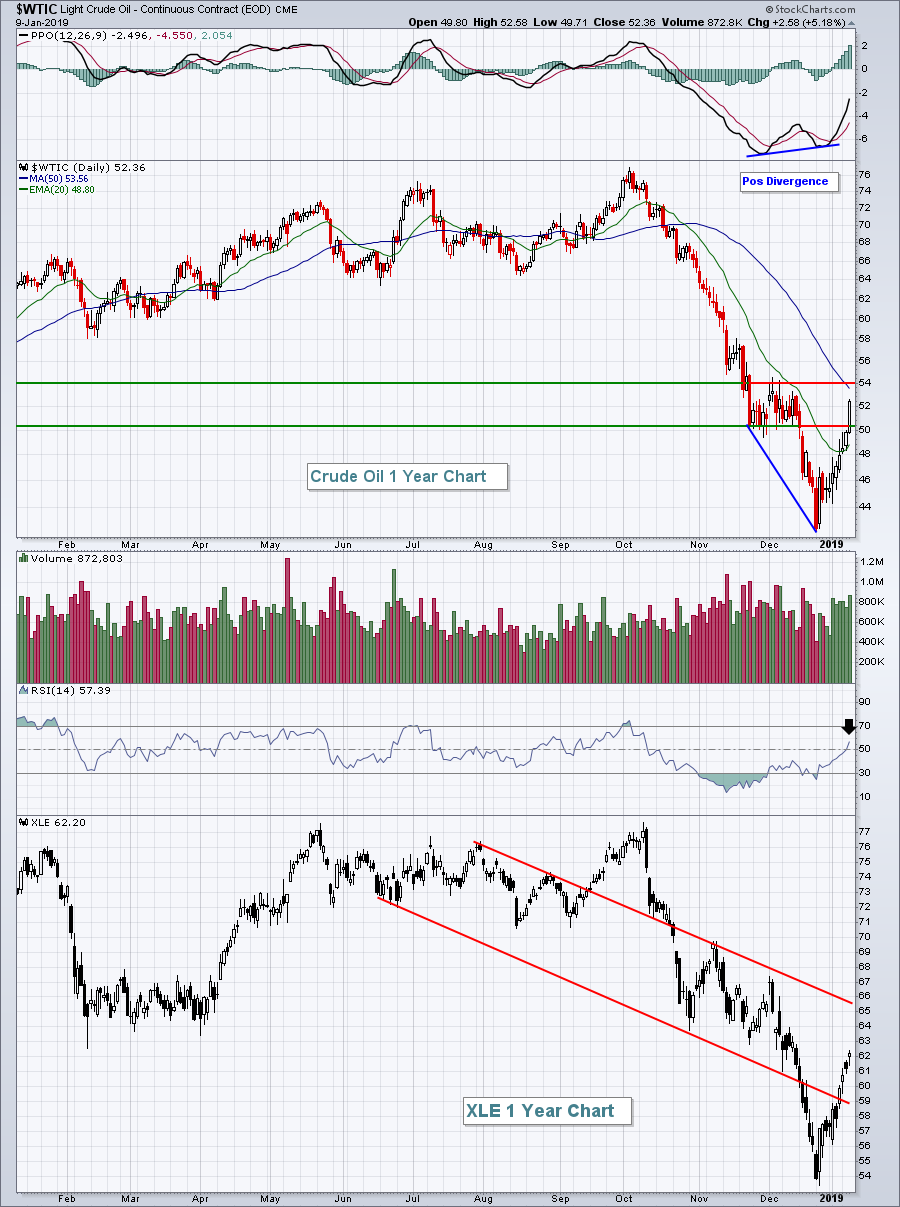
Crude oil ($WTIC, +5.18%) continued rolling higher on Wednesday, buoyed at least in part from its positive divergence. Recently, I discussed the likelihood that crude oil prices would move back into the $50-$54 per barrel range and you can see from the chart that's where we are now:
 Positive divergences typically result in 50 period SMA tests and/or PPO centerline tests. The WTIC is now close to its 50 day SMA and rapidly approaching its PPO centerline. Many times, positive divergences mark long-term bottoms and I believe that'll be the case here. I would, however, look for at least some congestion and consolidation between $50-$54 per barrel, which also should limit upside potential for energy stocks (XLE, +1.58%). I've drawn a down channel on the XLE, ignoring the outlying action from the September-October rally and the panicked selloff in December. Price resistance lies between 62-64, so the upper declining channel line will soon act as additional resistance near the top of that 62-64 zone. A long tail (intraday high) to the top, especially if it's above 64, should be respected.
Technology (XLK, +1.29%) also performed well on Wednesday as semiconductors ($DJUSSC, +2.19%) decided to join the party. The rebound in semiconductor shares since the December bottom has not been as pronounced as many other areas of the market. Skyworks Solutions (SWKS, +3.83%) warned, but apparently its 40% drop since July already built in the worst in terms of fundamental news. That will be something to watch closely as earnings season approaches. If companies warn about their upcoming quarter, but rise into that news, it could be a signal that the overall market weakness experienced since the beginning of Q4 won't last.
The three defensive sectors - consumer staples (XLP, -0.93%), utilities (XLU, -0.60%), and real estate (XLRE, -0.41%) - were the only groups to lose ground on Wednesday.
Pre-Market Action
A better-than-expected initial jobless claims report this morning (216,000 vs 224,000) is confusing an already-cloudy economic picture. We know there's been slowing in key areas of our economy as poor quarterly results/warnings from the likes of FedEx (FDX), Apple (AAPL), Micron Technology (MU) and NVIDIA (NVDA) can attest. But how deeply will our economy be affected and how long will it last? Those are two important questions that will only be answered with time. The U.S. stock market is an important leading economic indicator, so its direction from here will be extremely important.
The 10 year treasury yield ($TNX) is down 2 basis points this morning to 2.71% and has a lower low for the first time in the past five sessions. If the TNX rolls over, that's a signal that money is rotating back into the safety of treasuries - not a good signal for U.S. equities. But let's see what happens throughout the course of today's session.
Crude oil prices ($WTIC) are down fractionally after Wednesday's surge. That could put a lid on the energy rally, at least temporarily. Asian markets are mixed, but mostly lower. European markets are also down, but fractionally so.
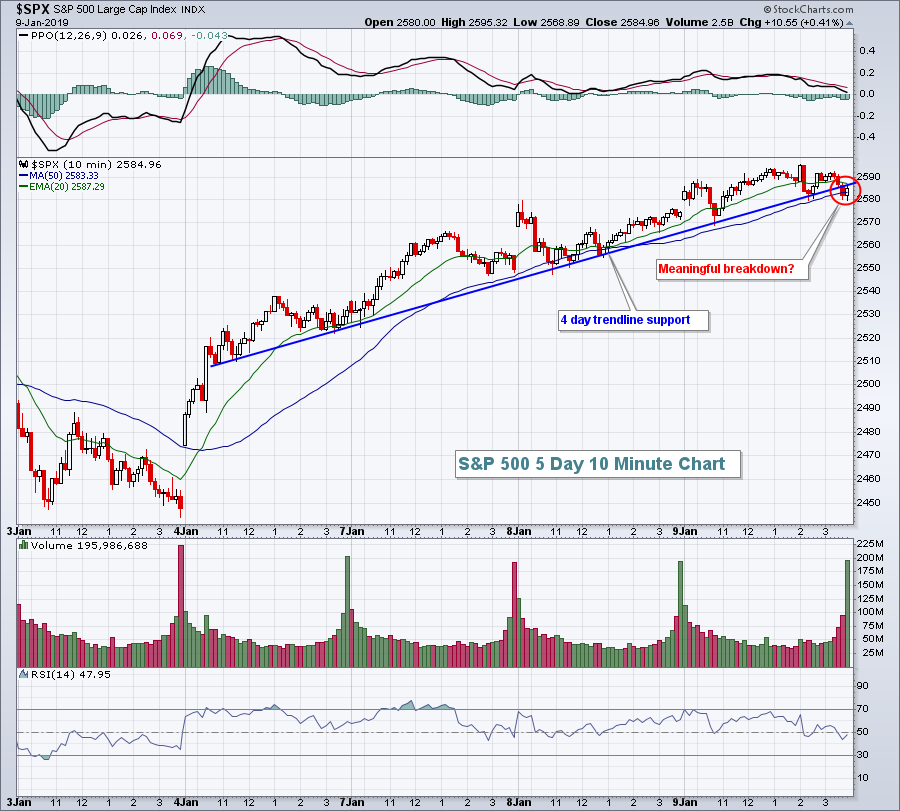
The upward thrust in U.S. equities appears to be slowing, but there's been no damaging move technically to the downside, other than a break of short-term intraday support on the S&P 500 as follows:
 The bad news is that there were multiple tests of this trendline - 10 or 11 by my count. The good news, though, is that this is a very short-term chart and there are several more important support levels below. The fact that it's occurring at a major price resistance level at 2581 does add a bit more bearishness.
Dow Jones futures are off their worst levels of the morning, but nonetheless pointing to a lower open. They're down 41 points with roughly 45 minutes left to the opening bell.
Current Outlook
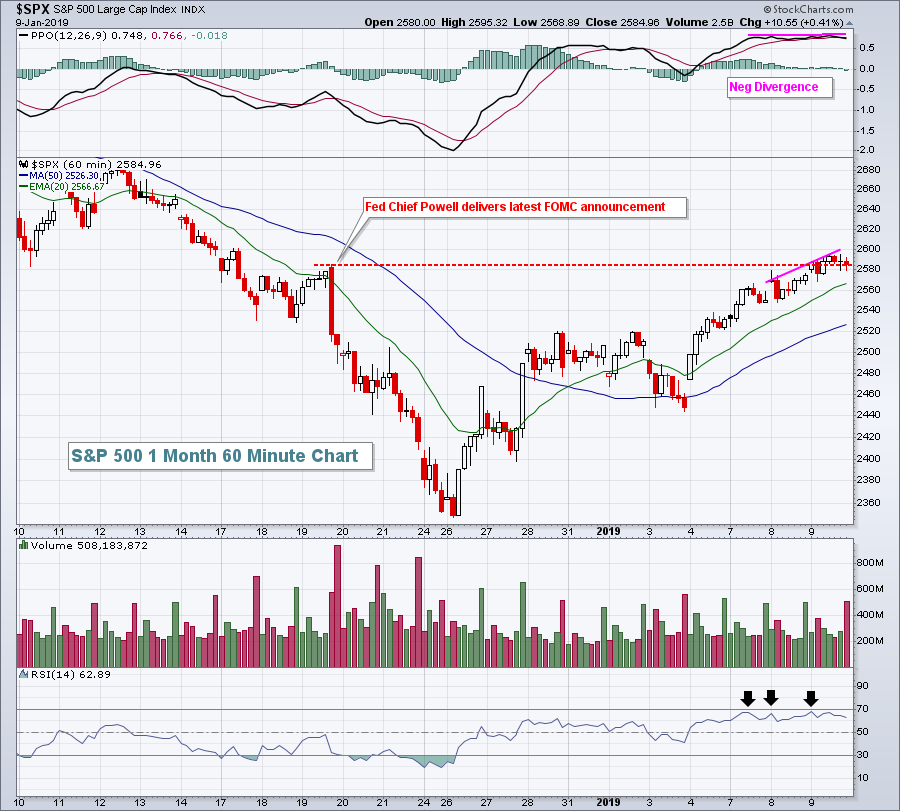
One short-term issue the U.S. stock market must deal with is the negative divergence appearing on 60 minute charts. During uptrends, these can be resolved rather easily and quickly by a brief period of selling and/or consolidation. Given the overall downtrend that began in Q4, however, a short-term negative divergence can be a signal to jump start the next leg down. While it's too early to tell if this is the case currently, you should definitely be prepared for the worst:
 The S&P 500 has now made up all of its losses since the infamous "two more rate hikes" FOMC announcement on December 19th that spurred panicked selling into the Christmas holiday. It's also the level where major price support (2581) resided from the February 2018 low close. So it makes sense this is an area where sellers would be lined up. Note also the black arrows marking short-term overbought conditions (RSI near 70). We hadn't seen that in a long time. Overbought in a bear market is not usually a good thing as it rarely lasts long.
Sector/Industry Watch
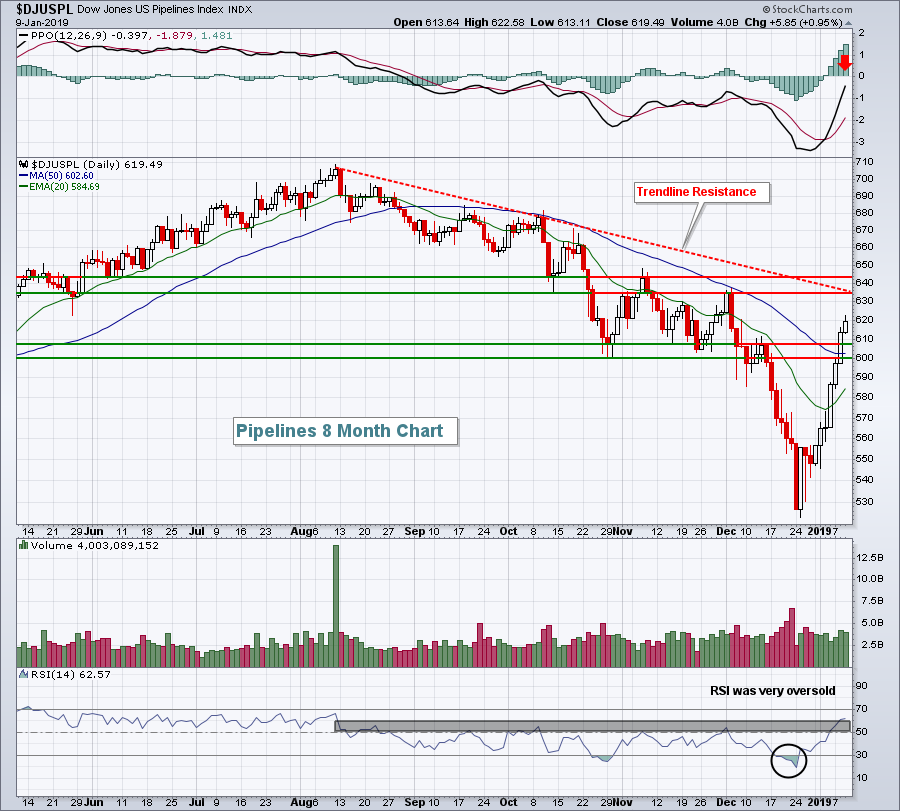
Pipelines ($DJUSPL) have made a huge move off their recent bottom, but the sledding could get a lot tougher as overhead price and trendline resistance approaches. Check out this chart:
 There are a number of warnings here. First, during downtrends, RSI trips into the 50-60 zone (black shaded area) tend to mark short-term price tops. We've moved slightly above 60 so watch for a reversing candle. The DJUSPL was able to pierce initial price resistance from 600-610, but the next area is more daunting. 635-645 should prove to be more difficult so a reversing candle there should not be ignored.
Historical Tendencies
Looking ahead, here is how the NASDAQ has performed (since 1971) over the next few calendar months (annualized returns):
January: +31.72%
February: +8.34%
March: +9.36%
April: +17.39%
The average annual return on the NASDAQ since 1971 is just above 11%, so February and March tend to be slightly weaker than normal.
Key Earnings Reports
(reports after close, estimate provided):
SNX: 3.25
Key Economic Reports
Initial jobless claims released at 8:30am EST: 216,000 (actual) vs. 224,000 (estimate)
November wholesale inventories to be released at 10:00am EST: +0.4% (estimate)
Happy trading!
Tom


