Market Recap for Friday, February 1, 2019
I'm sure I wasn't the only one thinking that the market was doomed on Friday after Amazon.com (AMZN, -5.38%) disappointed traders with its outlook during Thursday's after hours trading. After all, AMZN is a Wall Street darling and if they're seeing weakness ahead, so too should many others. But U.S. indices showed resiliency and grit more associated with a bull market than a bear market. Three of our four key indices ended the day higher as the Dow Jones, S&P 500 and Russell 2000 posted gains of +0.26%, +0.09%, and +0.18%, respectively. The NASDAQ clearly underperformed, as we would expect, losing 0.25%. But think about it....AMZN is the 800 lb. gorilla (and $800 billion market cap) in the room and they just lowered expectations in 2019. And much of the market went up!
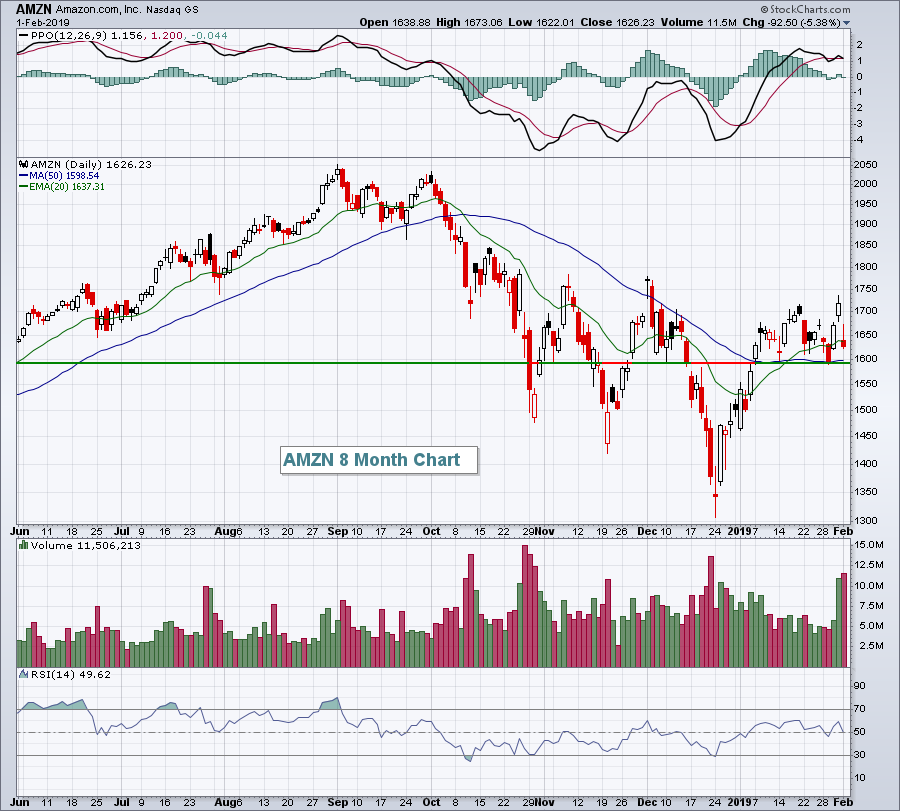
When Apple (AAPL) warned in early January, yes the market did rally higher. But we did have one day of decline in sympathy. With AMZN, there was little fallout. I have a couple thoughts here. First, AMZN itself did not fail to lose recent price support at 1590-1600. That's where buyers have appeared recently and, despite the warning, AMZN didn't test that level on Friday. The bulls remain in charge technically even though we saw a disappointing outlook and a 5% drop on Friday. Here's the key support level illustrated:
 Volume was heavy on the selling, but support held. It's the combination of price and volume that I'm most concerned about. So far AMZN remains in a bullish uptrend.
The second discussion point is the Volatility Index ($VIX) as it continues to fall. 16 has historically been a major support level for the VIX during bear markets. The 2000-2002 and 2007-2009 bear markets never saw the VIX fall below 16. The VIX closed at 16.14 on Friday. A bear market requires certain conditions (fear) much like a tornado requires certain weather conditions. If we see a VIX close below 16, I believe the December low on the S&P 500 will not be violated this year. We could still see periods of selling obviously, but I would not look for a true retest of that bottom.
Due to the AMZN disappointment, consumer discretionary (XLY, -1.46%) was easily the weakest sector Friday. But sector strength/weakness was evenly divided among sectors. Leading to the upside was energy (XLE, +1.74%) as crude oil ($WTIC, +2.73%) surged above $55 per barrel, its highest close and first above $55 in 2 1/2 months. Technology (XLK, +0.59%) also tacked on additional gains, closing at its highest level since early December.
Pre-Market Action
The 10 year treasury yield ($TNX) is up 2 basis points this morning and back above the 2.70% level, a short-term positive. Gold ($GOLD) is down $6 per ounce this morning, but remains in a very bullish uptrend.
Asian markets were mostly higher overnight, while trading in Europe is a bit more subdued, albeit fractionally higher.
U.S. futures are mostly flat as traders digest the huge rally off the December lows.
Alphabet (GOOGL) will be the last of the FAANG stocks to report their quarterly results after the bell tonight.
Current Outlook
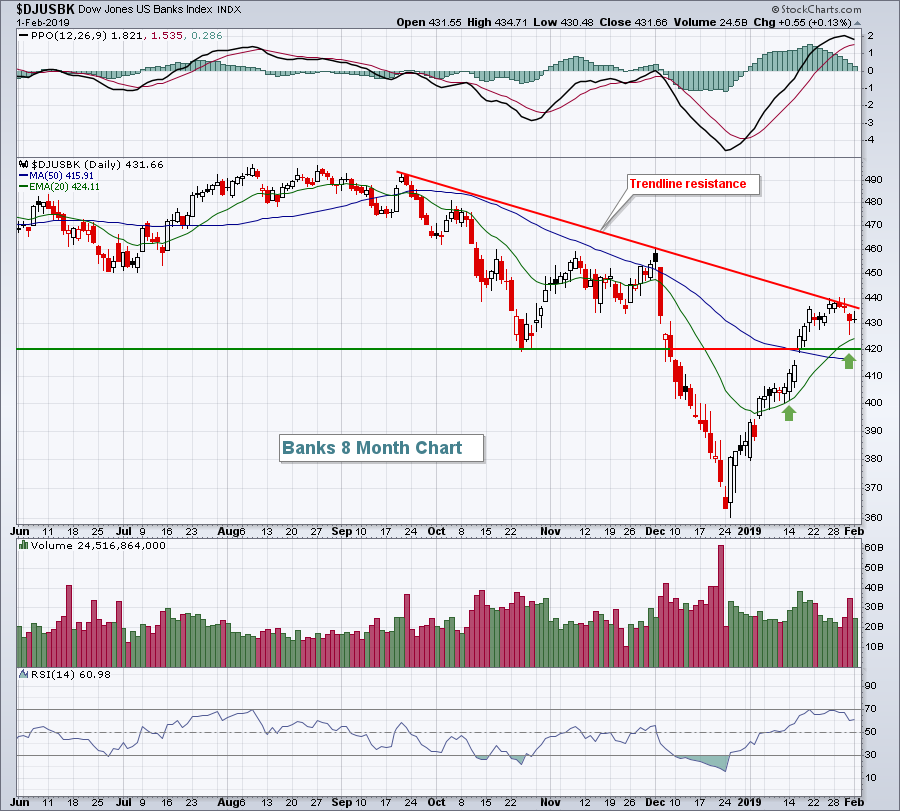
An important component of any market rally is the performance of banks ($DJUSBK). Banks don't have to lead a rally, but we definitely want to see them participate and at least "go along for the ride". They've been going along for the ride since late-December and the group's technical picture has improved substantially as a result:
 I do believe banks have reached a potential inflection point. We've seen a tremendous rally, but that came after a massive drop in the DJUSBK. Let's keep everything in perspective. The downtrend line on the above chart suggests a move lower from here would be reasonable from a technical outlook. Uptrends, however, usually show support at the rising 20 day EMA (currently 424). We know from the October low that traders are well aware of that 420 price support. Therefore, to the downside, the bulls will looking to support in that 420-424 area. Failure to hold support there would clearly cater to the bears' desire for lower prices. A break above 440, though, would be further evidence of higher prices to come. There's a triple top at 460 that would come into play if 440 is cleared.
Sector/Industry Watch
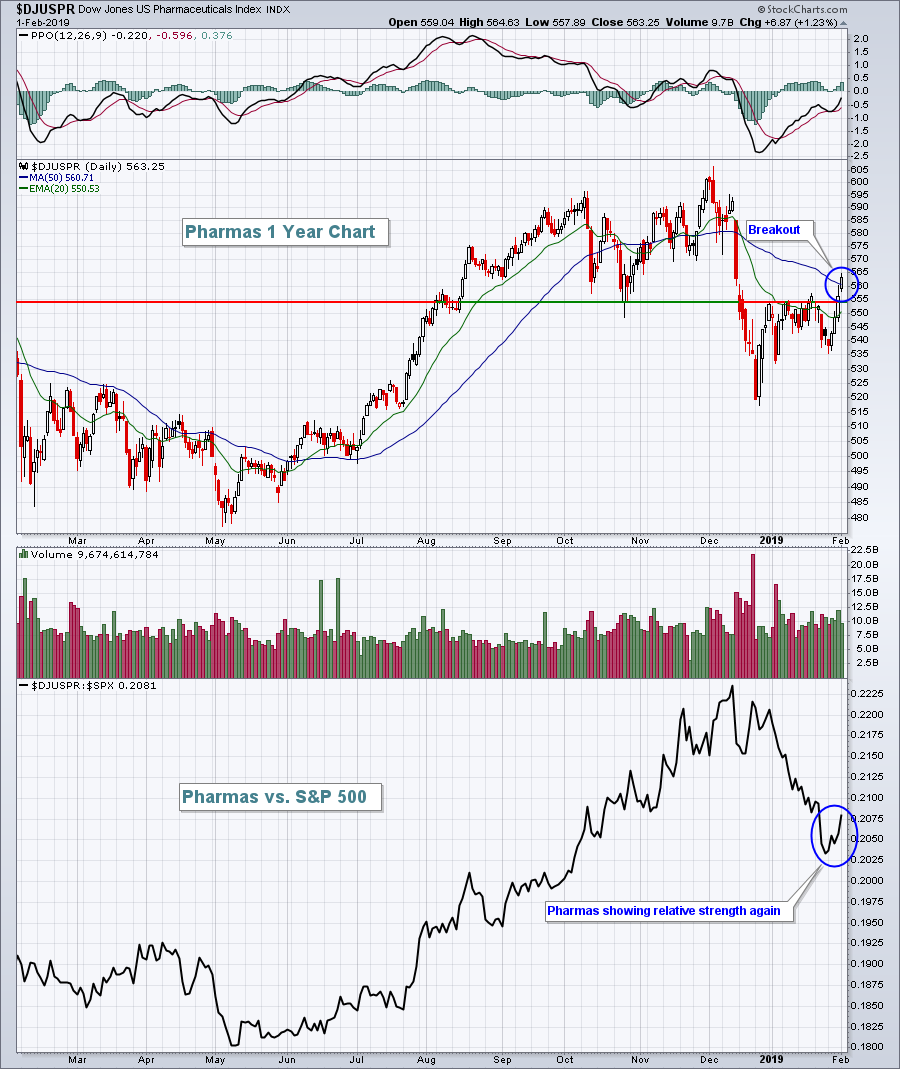
Pharmaceuticals ($DJUSPR) showed excellent relative strength throughout the second half of 2018. But during the recent cyclical bear market rally, money has rotated away from this defensive industry group. Last week, however, the DJUSPR broke out and did so with increasing relative strength, a very bullish development for this group. Take a look at the improving technical outlook:
 In addition to clearing recent overhead price resistance, the DJUSPR managed to close above its 50 day SMA on Friday as well, encouraging more technical buyers. I look for the group to move higher and have selected a pharma as my Monday Setup this week.
Monday Setups
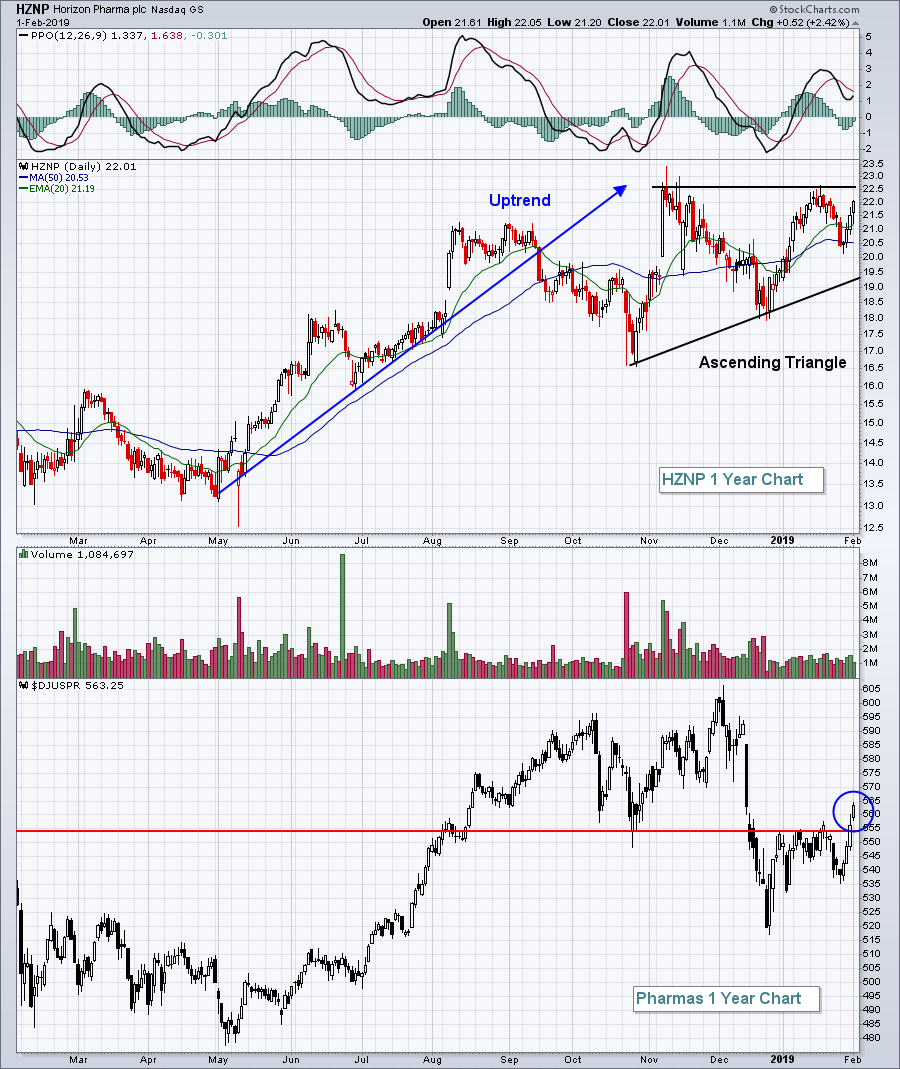
The short-term direction of the stock market remains somewhat of a mystery to me as cyclical bear markets have typically seen retests of initial lows. But the 2019 version has already recovered a larger portion of the bear market decline than either of the last two cyclical bear markets in 1998 and 1990. So will this one be different? I'm not sure, but trading on the long side after the recent rally takes courage and a disciplined strategy for entry and exit in the event that the rally ends abruptly. For this week, I'm going with Horizon Pharma (HZNP):
 HZNP has been an outperformer in a defensive industry group - pharmas. There's a decent chance that even if the overall market takes another tumble, it'll hold onto its bullish ascending triangle support. So I'd consider entry at the current price and again on any selling down to 20.25. A close below 19 would be problematic for the triangle pattern. Eventually, I'd look for a target of 28.00-29.00 based on the pattern measurement.
Historical Tendencies
The end of January typically favors the bulls, but this week tends to be bearish. The Russell 2000, for example, has produced negative annualized returns 5 of the next 7 calendar days, including today (February 4) and tomorrow (February 5) where it's produced annualized returns of -105.85% and -61.07%, respectively.
Key Earnings Reports
(actual vs. estimate):
ALXN: 2.14 vs 1.83
CLX: 1.40 vs 1.32
SYY: .75 vs .72
(reports after close, estimate provided):
ARE: 1.69
AVB: 2.32
GILD: 1.74
GOOGL: 11.08
HIG: .65
ITUB: .18
QGEN: .40
STX: 1.27
Key Economic Reports
November factory orders to be released at 10:00am EST: +0.3% (estimate)
Happy trading!
Tom


