Market Recap for Friday, February 22, 2019
Software stocks ($DJUSSW, +1.44%) continued their impressive dash higher, eclipsing their October high to enter all-time high territory. It was a significant breakout as the DJUSSW has been a relative leader for a long, long time. Check this out:
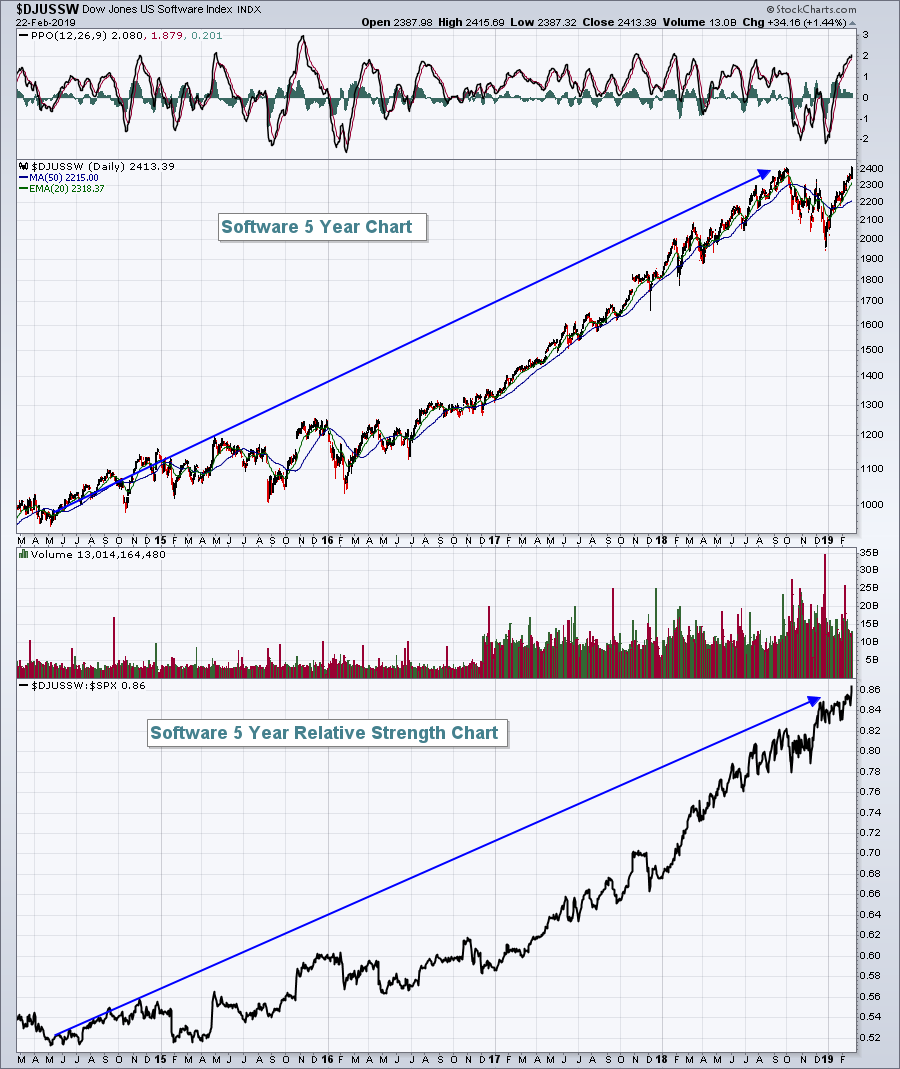 Perhaps the most impressive piece of this chart is that software never lost its relative strength during the Q4 market debacle. Normally recession fears would drive the high growth area of the market much, much lower on both an absolute and relative basis. While software's absolute chart suffered, its relative strength never did. Now the group is breaking out on both an absolute and relative basis. Excellent action.
Next is telecom equipment ($DJUSCT, +1.40%). While it's just beneath a key absolute price breakout, it too has broken out on a relative basis:
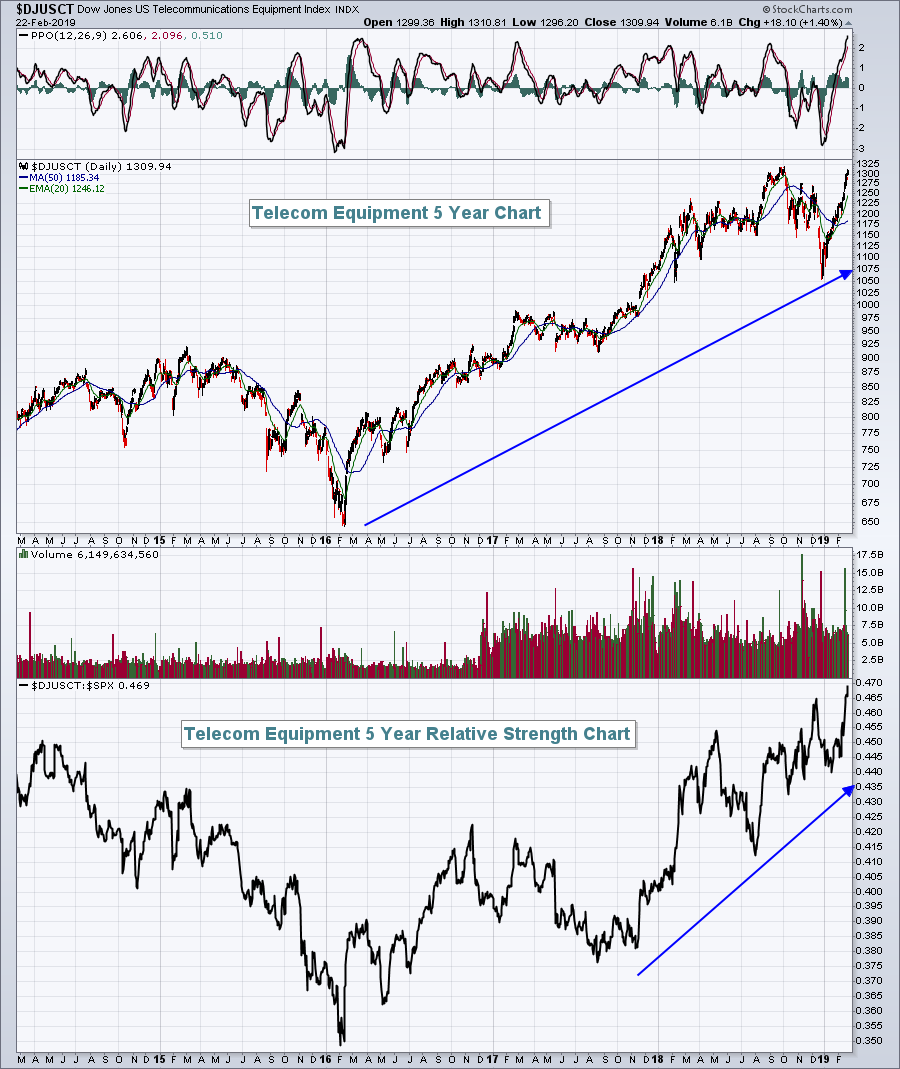 If you're trying to outperform the benchmark S&P 500, it's much easier to do so if you trade companies within leading industries.
As you might expect, technology (XLK, +1.28%) was the sector leader on Friday. But there was plenty of strength to go around. Communication services (XLC, +0.94%) and healthcare (XLV, +0.92%) were both very strong as well.
Weakness was centered around consumer staples (XLP, -0.48%) and financials (XLF, -0.15%), the latter continuing to struggle with a 10 year treasury yield ($TNX) that won't seem to budge higher. The TNX fell 3 basis points on Friday and a falling treasury yield has the tendency to lower bank ($DJUSBK) and life insurance ($DJUSIL) profits.
Pre-Market Action
Crude oil prices ($WTIC) and gold ($GOLD) are both seeing profit taking this morning, especially crude oil, which is down 2.43% and back below $56 per barrel. Asian markets were buoyed by President Trump's decision to delay March 1st tariffs, citing trade progress. The Shanghai Composite ($SSEC) was up more than 5% overnight. European markets are also mostly higher this morning on trade optimism.
In the U.S., futures are pointing to a very strong open with the Dow Jones poised to open roughly 165 points higher.
Current Outlook
Of the five aggressive sectors, consumer discretionary remains the strongest in my opinion. The following relative strength chart vs. the benchmark S&P 500 should help to illustrate my point:
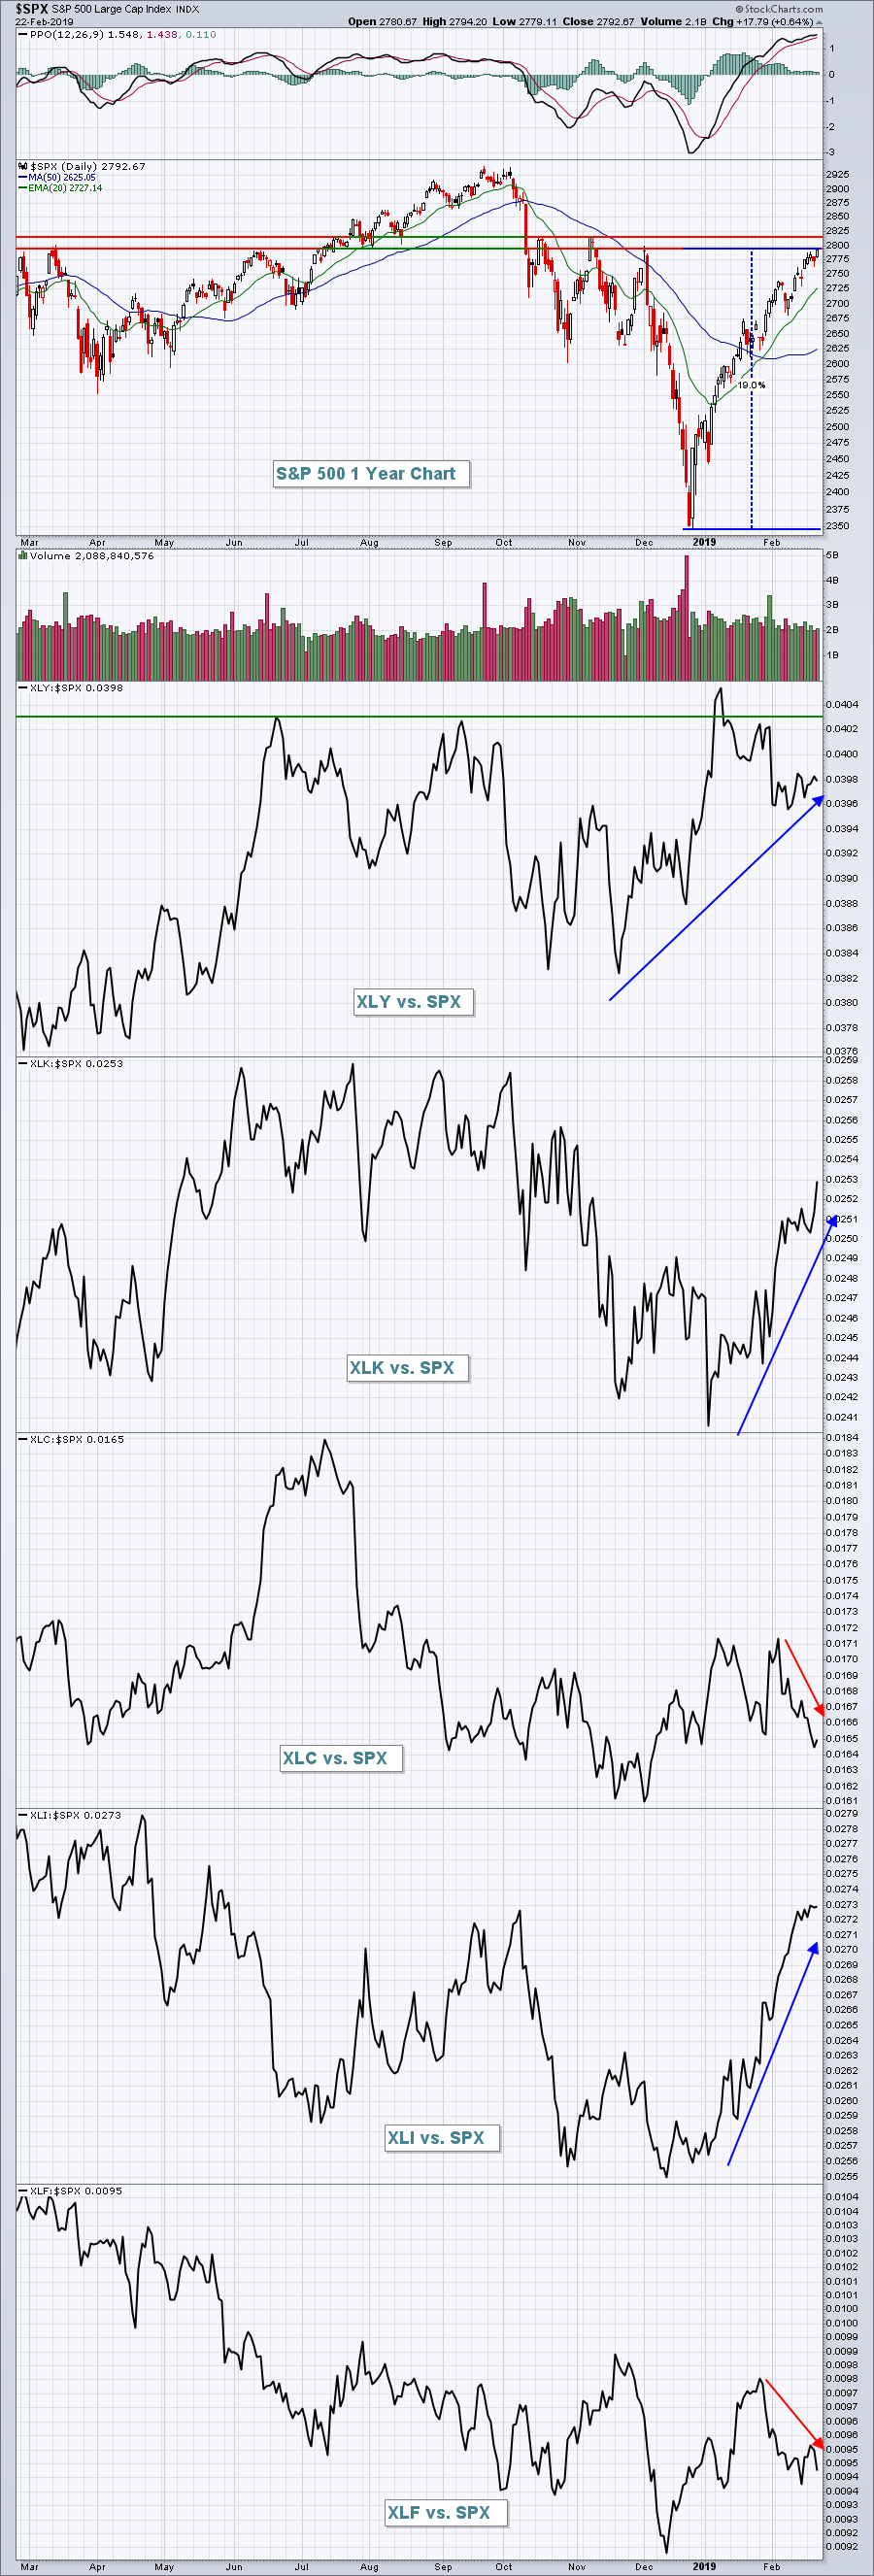 The XLY is the only sector ETF to make a 52 week relative high during this cyclical bear market. And despite the 19% or so rally off the December low, we remain in a bear market. Technically, the bear market doesn't end until the S&P 500 rallies to a new all-time high. It still has another 5% to the upside left to clear its September/October highs. The recent relative weakness in the XLY sets it up beautifully for relative strength in the upcoming months. Seasonality adds to my conviction:
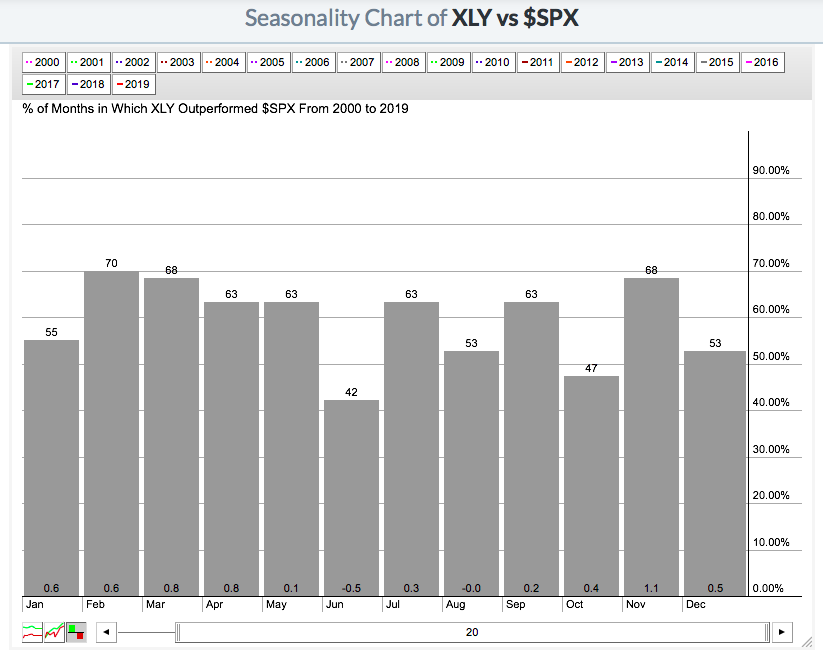 Historically, the first four months of the calendar year produce XLY gains that outperform the S&P 500 by 2.8 percentage points (adding the average monthly outperformance of these months above). Given the overall relative strength of the XLY, but the underwhelming relative performance in January and February as the XLY has consolidated, I see relative strength returning in March and April to lead the S&P 500 higher.
Sector/Industry Watch
The Dow Jones U.S. Mobile Telecommunications Index ($DJUSWC) has broken out of a descending triangle after an extended uptrend. This appears to be an end to its consolidation period, so I'd look for outperformance from this group in the weeks ahead:
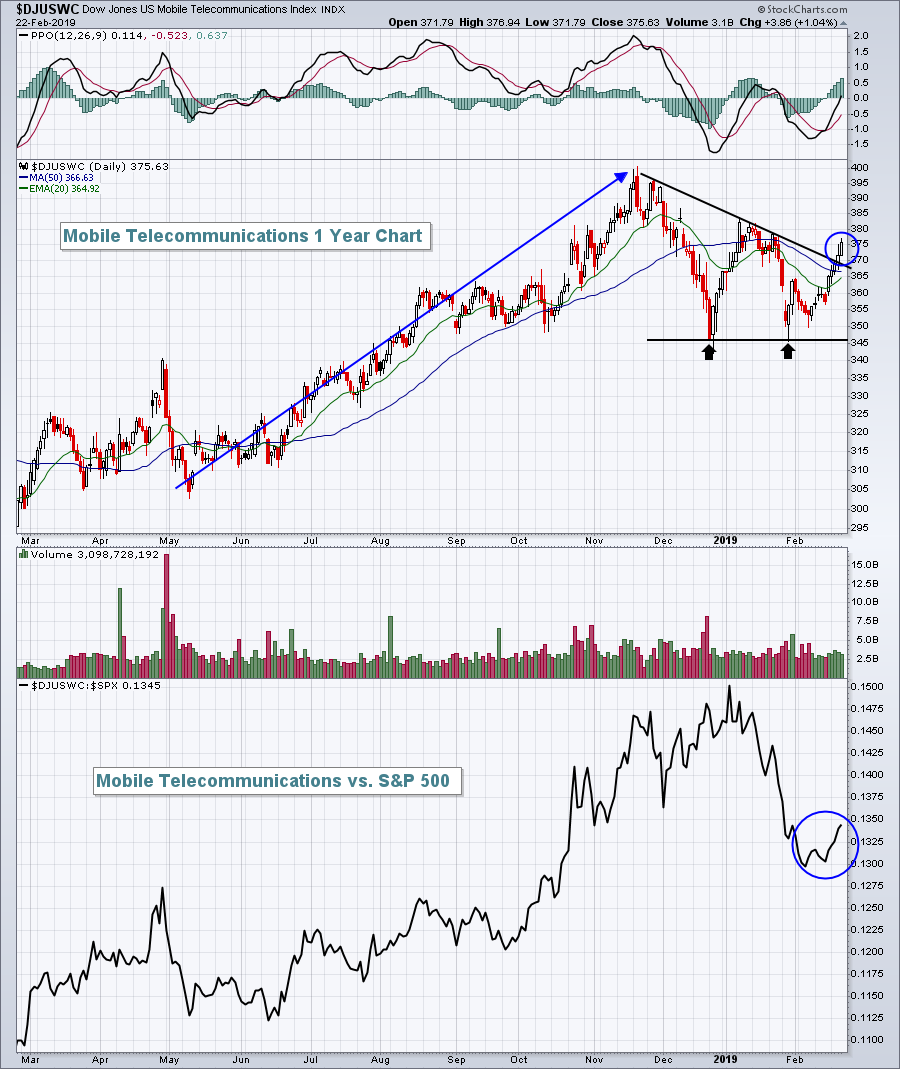 The blue circles highlight not only the absolute breakout of the triangle pattern, but also the clear turn higher in relative performance. Watch the recent relative low that printed in early February to make sure that holds. So long as it does, the DJUSWC seems like a logical area of the market to trade.
Monday Setups
This week I'm going with an airline - one of the best airlines technically. Spirit Airlines (SAVE) not necessarily a favorite among airline customers due to their charges for everything, is definitely a favorite among investors and has been a tremendous performer off its September 2017 low, nearly doubling since then. SAVE is currently in a bullish ascending triangle pattern off an uptrend, suggesting this upside move likely has more room to run:
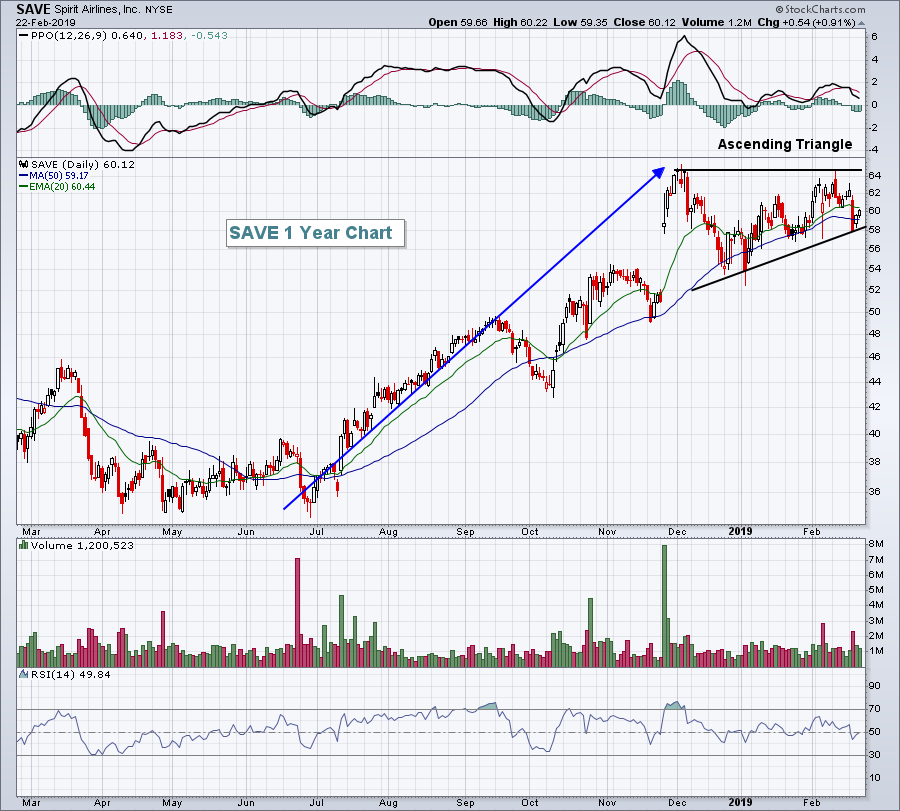 A closing breakout above 65 would ultimately lead to a pattern measurement in the 76-77 area, while a close below 57 would be of concern to me.
Historical Tendencies
Since 1950, March has trailed only November, December and April in terms of S&P 500 performance. Here's the leaderboard:
November: +18.46%
December: +17.52%
April: +16.86%
March: +13.90%
Furthermore, March has easily been the best month for the S&P 500 relative to the NASDAQ. Since 1971, the S&P 500 has produced an annualized return of +14.31% during March, while its NASDAQ counterpart has produced an annualized return of +9.36% over the same period.
Key Earnings Reports
(reports after close, estimate provided):
ALSN: .95
ATH: 1.22
BWXT: .59
EPR: 1.37
ETSY: .31
MOS: .57
OKE: .74
PODD: .06
RP: .38
Key Economic Reports
December wholesale inventories to be released at 10:00am EST: +0.3% (estimate)
Happy trading!
Tom


