Market Recap for Tuesday, February 26, 2019
In what has become a rarity in 2019, all of our major indices finished in negative territory on Tuesday, but it wasn't without a fight. There was early selling, but stocks rallied throughout much of the session to forge to intraday gains before a final selling binge landed equities back in negative territory by the close:
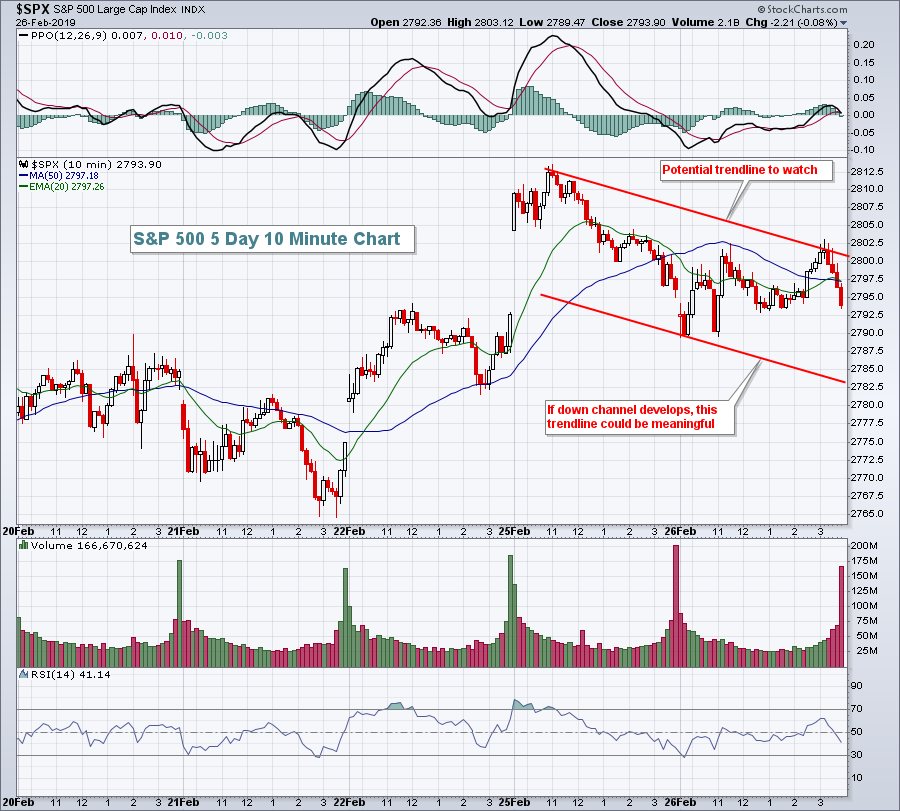 The tops from the last two days could be the beginning of a downtrend line. Also, the slope of this downtrend line can be attached to Tuesday's early morning low to establish what might become a down channel. It's too early to count on either of these lines acting as support and resistance, just something to watch as today's trading unfolds.
The selling on Tuesday was clearly heavier on the small cap Russell 2000 index, which is showing cracks in its 2019 relative strength vs. the benchmark S&P 500. Here's an update to the chart I provided yesterday:
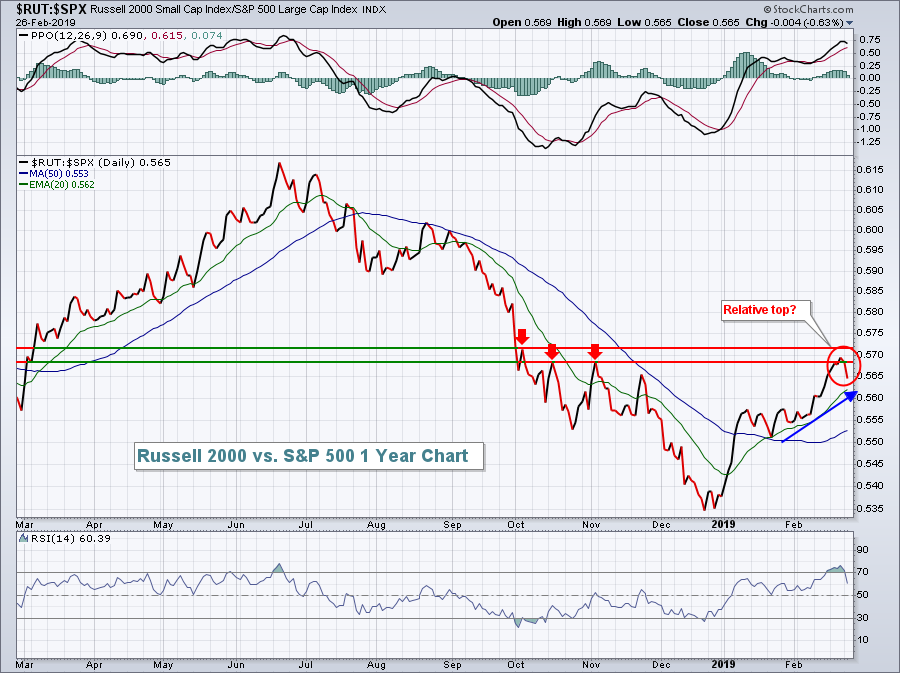 The relative top estabished last Friday is now more pronounced as the S&P 500 is playing catch-up with its smaller cap counterparts. I do look for further outperformance in small caps later in 2019 and a break above relative resistance near 0.57 would be very bullish for small cap stocks.
By day's end, technology (XLK, +0.21%) and consumer discretionary (XLY, +0.14%) emerged as relative leaders among sectors. It's worth noting that both groups represent aggressive areas of the market, so their strength is a solid signal that bulls remain in charge of the short-term action. Software ($DJUSSW, +0.45%) provided leadership once again as the group continued in breakout mode:
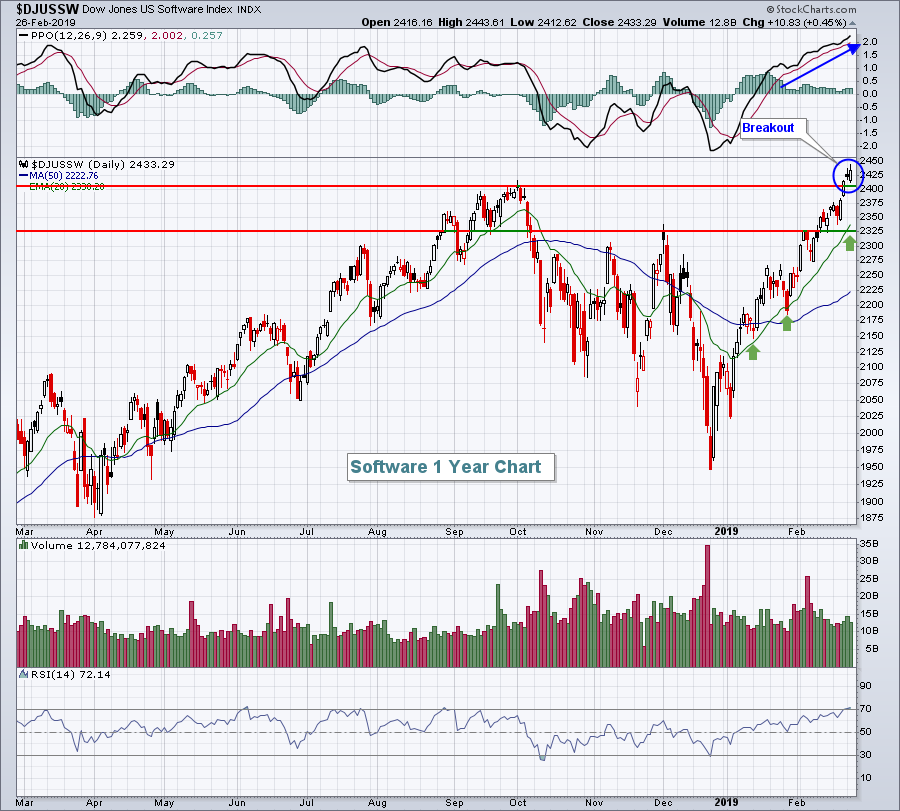 The DJUSSW is now overbought with an RSI reading of 82, so a pullback could occur at any time. Should the breakout level near 2400 fail to hold as price support, the rising 20 day EMA, currently at 2338, should provide excellent support given the acceleration of bullish momentum (PPO).
Materials (XLB, -0.57%) was the primary laggard Tuesday, although more than half of the sectors ended with losses.
Pre-Market Action
Asian stocks were mixed overnight, while equities are down in Europe this morning. We're seeing early weakness in futures, with Dow Jones futures lower by 46 points with 30 minutes left to the opening bell.
Crude oil ($WTIC) is up approximately 2% this morning, which could give the energy sector (XLE) a boost today. The 10 year treasury yield ($TNX) continues to bounce off recent yield support at 2.63%, up 2 basis points to 2.65% this morning.
Lowe's (LOW) is rallying this morning after reporting its latest quarterly results, which included an earnings miss. But their outlook was solid and traders seem to be focusing more on the future outlook of companies, rather than the disappointing past.
Current Outlook
The rally in the benchmark S&P 500 has been quite impressive off that December low. The bulls have been able to clear one obstacle after another, and the S&P 500 is now within striking distance of its all-time high above 2900. One obstacle cleared was the 20 week EMA, which typically serves as solid overhead resistance in a bear market. Now that we're above that key moving average, we should look to it as support - from a bullish perspective. At some point, we'll see a more extended period of selling and/or consolidation and the rising 20 week EMA will come into play. How the S&P 500 reacts on that test will likely serve as confirmation as to where we're heading in the intermediate- to long-term:
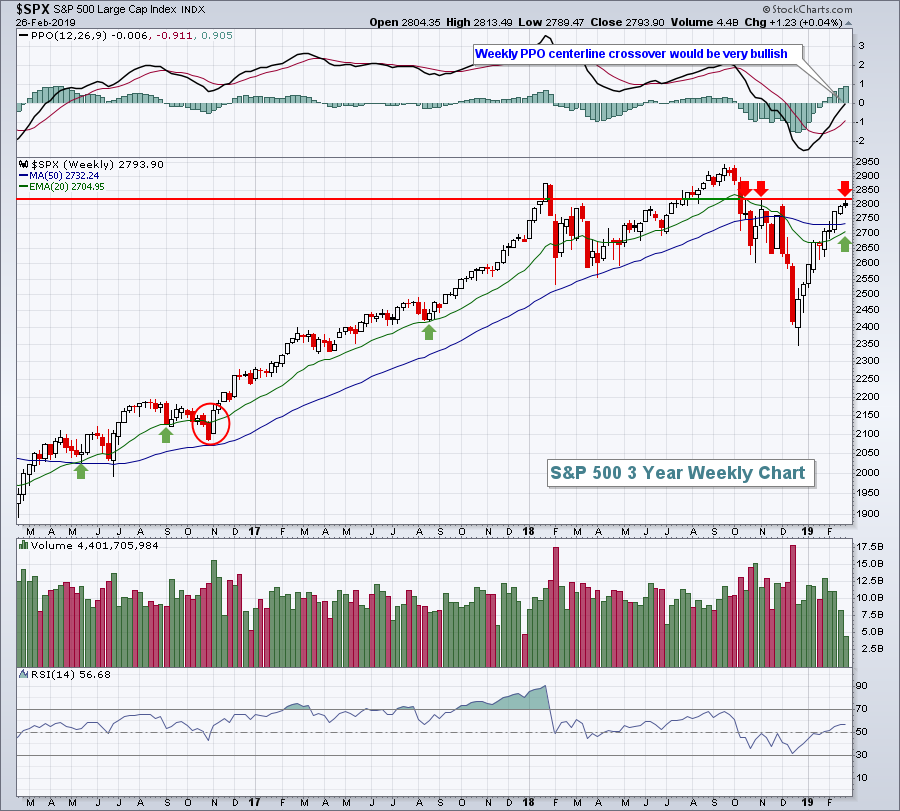 Reaction highs in October, November and December (red arrows) all failed between 2800 and 2820, so the short-term goal of the bulls is to clear this overhead price resistance zone. In the meantime, the latest green arrow marks the weekly support to watch - the 20 week EMA, currently at 2705. Therefore, that's the range I'm watching for now, 2705-2820.
Sector/Industry Watch
Travel & tourism ($DJUSTT) has rallied beautifully back above its 20 week EMA and is now resting almost squarely on its 50 week SMA. It remains in a longer-term uptrend with key price support and resistance highlighted on the chart below:
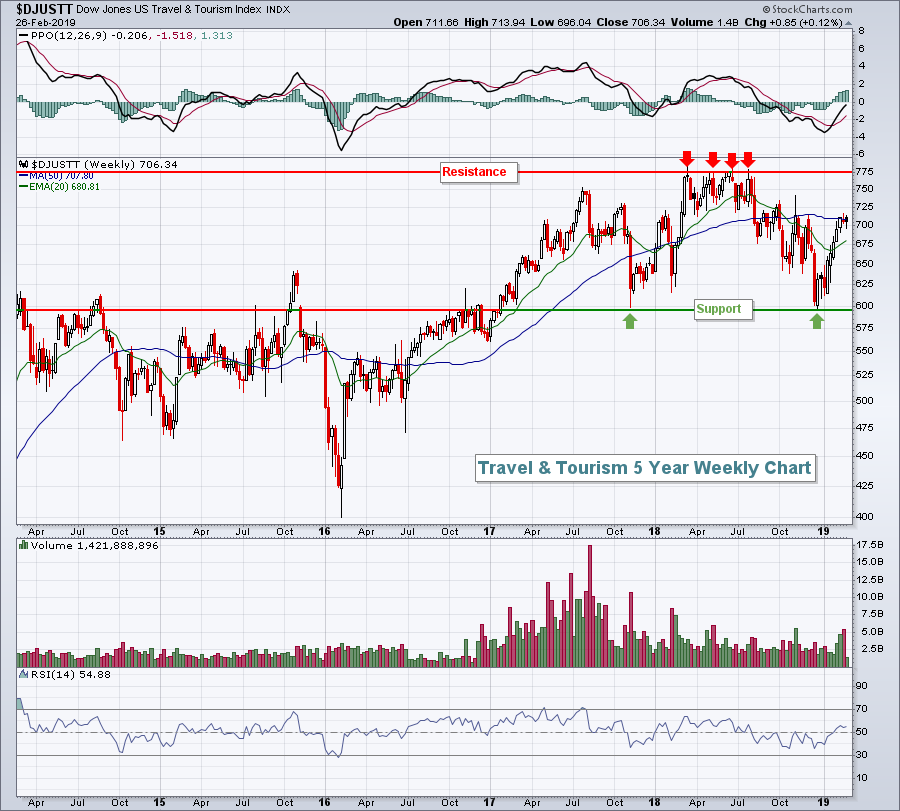 After the bell tonight, we'll likely know a lot more about this chart. Booking Holdings (BKNG) reports is latest quarterly results and that report will likely go a long way in determining whether the DJUSTT breaks out or breaks down.
Historical Tendencies
I've discussed the strong seasonal history of Booking Holdings (BKNG) on several occasions. For those that haven't seen it, the February through April seasonality is remarkably bullish:
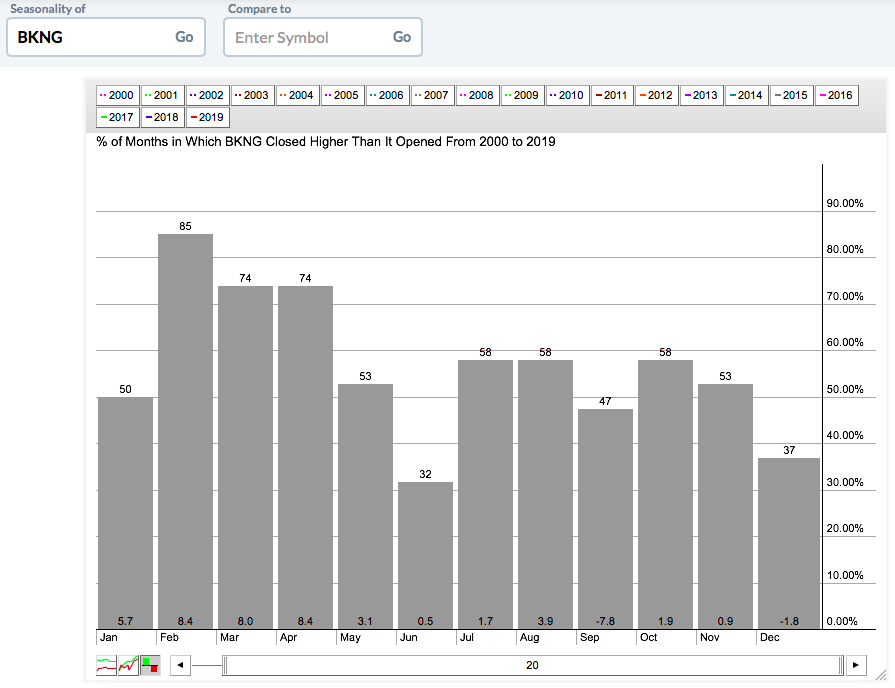 BKNG has averaged gaining at least 8% in each of the three months from February through April over the past two decades. BKNG reports its quarterly results today after the closing bell.
Key Earnings Reports
(actual vs. estimate):
AMT: 2.40 vs 2.30
BBY: 2.72 vs 2.57
LOW: .80 vs .80
PEG: .55 - estimate, awaiting results
TJX: .59 vs .68
(reports after close, estimate provided):
APA: .25
BKNG: 19.39
HPQ: .52
MNST: .40
SQ: .13
UHS: 2.35
Key Economic Reports
December factory orders to be released at 10:00am EST: +0.6% (estimate)
January pending home sales to be released at 10:00am EST: +1.0% (estimate)
Happy trading!
Tom


