Market Recap for Thursday, April 25, 2019
Strong earnings from Microsoft (MSFT, +3.31%) and Facebook (FB, +5.85%) lifted the NASDAQ to gains on Thursday, while broader market bearishness carried the other major indices to losses. 3M Co (MMM, -12.95%) was a disaster on the Dow Jones, which lost 135 points on the session.
Sector performance was bifurcated as well. Communication services (XLC, +1.12%) and healthcare (XLV, +1.03%) were clear leaders, but industrials (XLI, -2.01%) and materials (XLB, -1.27%) were a drag on our indices. The latter is no doubt struggling with the recent surge in the U.S. Dollar Index ($USD, +0.07%), which extended its Wednesday breakout to highs not seen since May 2017. The XLI suffered nearly across-the-board as only aerospace ($DJUSAS, +0.92%) managed to end the day in positive territory. Delivery services ($DJUSAF, -6.34%) were crushed after United Parcel Service (UPS, -8.13%) "delivered" an awful quarterly report. The volume on UPS was over 10 million shares and was its highest volume level in more than a year.
Pre-Market Action
We saw a big surprise in Q1 GDP when it came in at 3.2%. The Wall Street consensus estimate was pegged at 2.3%. Despite the much-stronger-than-expected report, the 10 year treasury yield ($TNX) is slightly lower and Dow Jones futures are up just 13 points as we near the opening bell.
Energy (XLE) is receiving a double dose of bad news this morning. Crude oil prices ($WTIC) are down 2% to $63.91 per barrel and Exxon Mobil (XOM) missed its EPS estimate by a wide margin. XOM also fell short of revenue estimates.
Current Outlook
From a short-term momentum trader's perspective, earnings-related gaps are most definitely my favorite trade setup. I have more confidence trading companies that have beaten both their revenue and EPS estimates as I feel there's less risk that fundamental news will be released that crushes my position. Rather than spend time in this section today evaluating big picture thoughts and ideas, let's instead review an earnings-related gap strategy that has worked beautifully for me in the past. As always, pain threshold should be one of the first steps we consider. Where is the point on the chart that says "get out" and live to trade another day? Then the second step is to determine what your profit goal is on the stock. In other words, where is your target? Evaluating those two steps will identify your reward-to-risk (R2R) on the trade. I won't trade any stock if my R2R is less than 2 to 1.
Putting this strategy into motion, let's check out Omnicom Group (OMC):
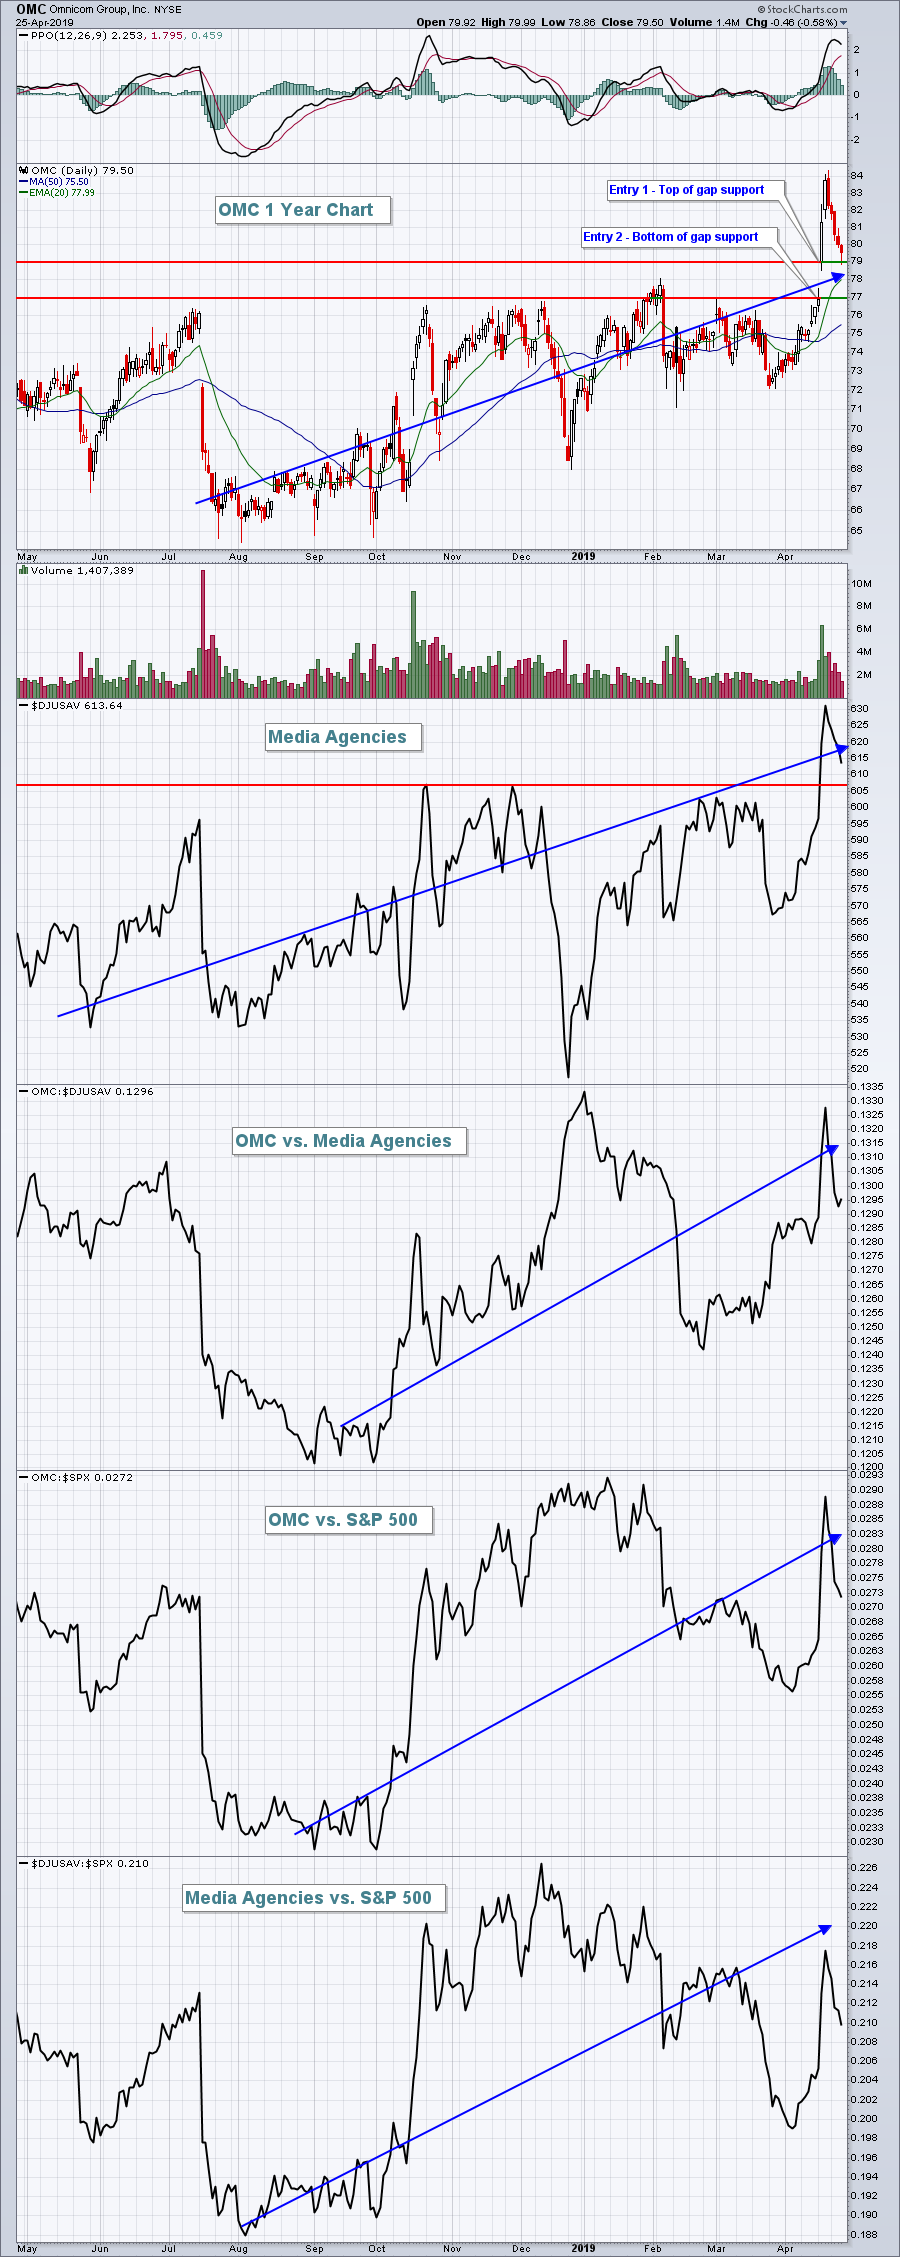 I like two entries here, the first at the top of gap support and the second at the bottom of gap support. The average of those two entries is roughly 78 and I'd keep a closing stop beneath 76.75. My target would be the recent high at 84. My reward would be 6 dollars from 78 to 84 and my downside risk would be 1.25 (could be more if OMC closes well below the 76.75 closing stop. An intraday stop could be considered if closing stops bother you, but that carries risk as well as many times stocks will pierce key support intraday, only to reverse and close above that level.
I have some other examples that I can send you if you drop me a line at tomb@stockcharts.com. You won't need to be a StockCharts member to see the additional charts, but you will need to be a member in order to download and save the charts into a StockCharts ChartList.
Sector/Industry Watch
Let's get back to the second part of my headline today. First, let me be clear. The materials sector (XLB) is not in a bear market. But if we look at the group's relative performance, it's been in a relative bear market for 8 years and it's because of the U.S. Dollar Index ($USD), which just broke out to the upside once again. Check this out:
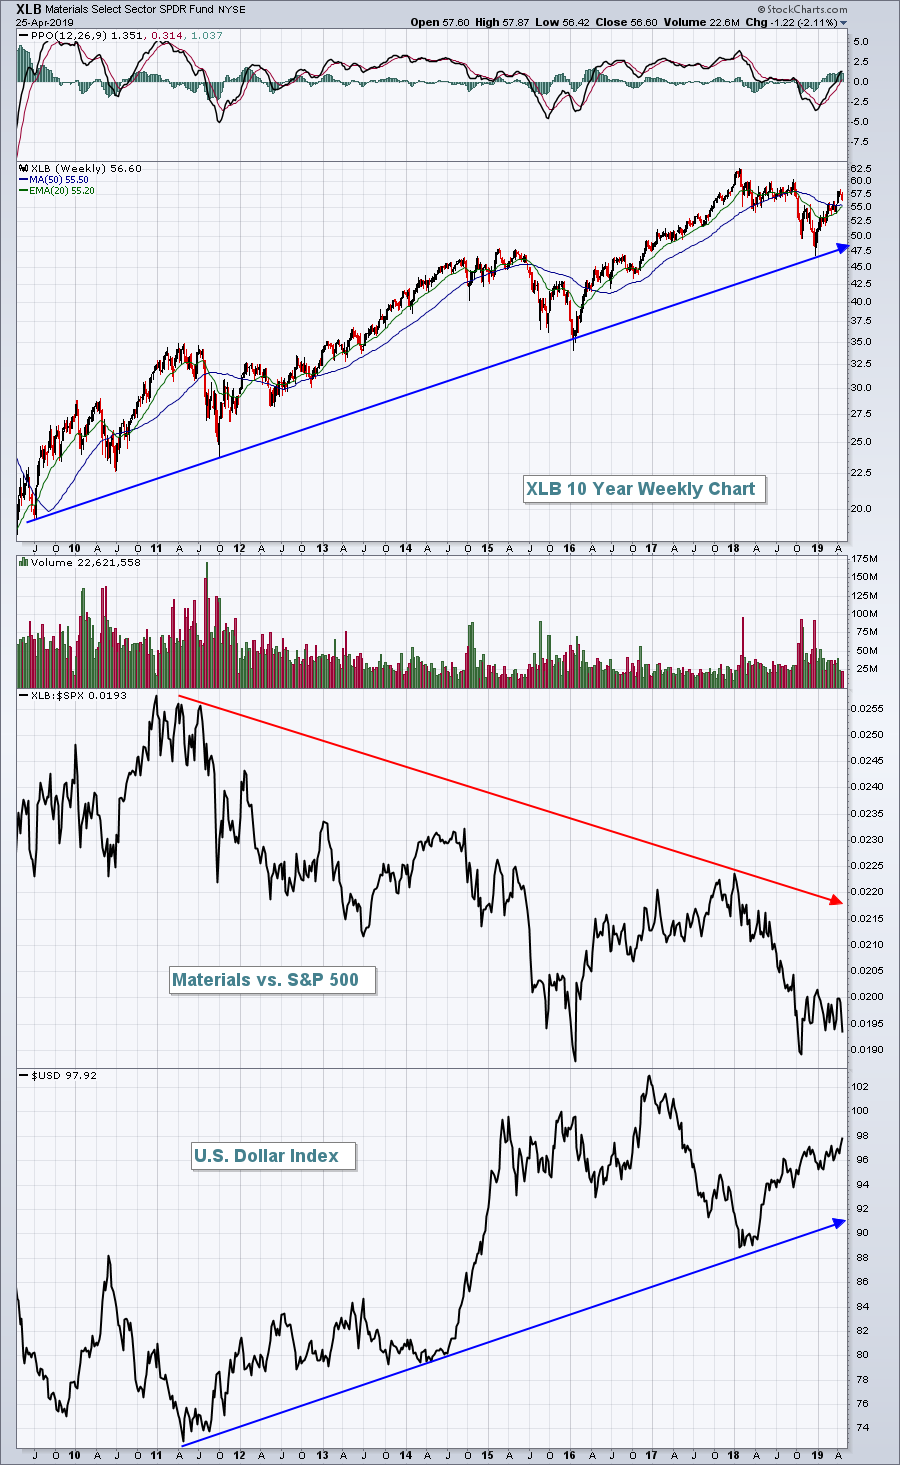 Yes, the XLB has been rising throughout the current bull market, but it's relative performance is very poor. The rising dollar creates headwinds for materials stocks and causes significant underperformance vs. the benchmark S&P 500. If you invest in the XLB, your chances of outperforming the S&P 500 are diminished so long as the USD remains in a long-term uptrend.
Historical Tendencies
I've posted this many times in the past, but we are entering the part of calendar months where we see the most bullish historical tendencies. Since 1950, the S&P 500 has produced annualized returns by time of the month (all months, not just April) as follows:
26th through 6th: +20.73%
7th through 10th: -5.78%
11th through 18th: +13.75%
19th through 25th: -8.88%
Key Earnings Reports
(actual vs. estimate):
AAL: .52 vs .51
ADM: .46 vs .62
ALV: 1.20 vs 1.57
AON: 3.31 vs 3.31
AZN: .45 vs .43
BEN: .64 - estimate, awaiting results
CL: .67 vs .66
COG: .73 vs .67
CVX: 1.26 - estimate, awaiting results
IMO: .29 vs .38
IPG: .11 vs .06
LEA: 4.00 vs 4.06
LYB: 2.22 vs 2.20
SNE: .19 - estimate, awaiting results
SNY: .81 vs .74
VTR: .99 vs .96
WY: .11 vs .11
XOM: .55 vs .75
ZBH: 1.87 vs 1.86
Key Economic Reports
Q1 GDP (initial) released at 8:30am EST: 3.2% (actual) vs. 2.3% (estimate)
April consumer sentiment to be released at 10:00am EST: 97.1 (estimate)
Happy trading!
Tom


