Market Recap for Tuesday, April 30, 2019
Alphabet (GOOGL, -7.50%) set the stage for a rough day on the NASDAQ (-0.81%) as the internet giant posted quarterly results that didn't impress Wall Street. The small cap Russell 2000 lost 0.45%, losing ground vs. the benchmark S&P 500 for only the second time in the last six trading sessions. While all of our major indices dropped at the open, both the Dow Jones and S&P 500 rebounded to finish with gains (+0.15% and +0.10%, respectively) by the close.
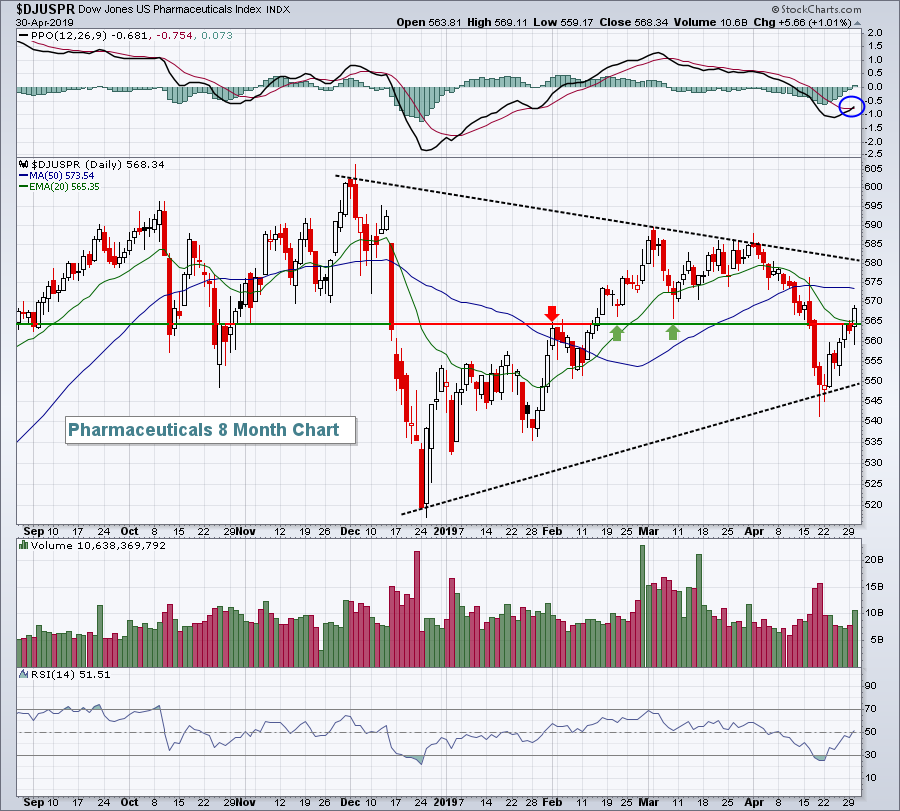
The rebound was likely tied to a series of solid earnings reports from the likes of Merck & Co (MRK, +2.51%), Pfizer, Inc. (PFE, +2.58%) and Mastercard (MA, +2.88%). Pharmas ($DJUSPR, +1.01%) were among three healthcare industry groups that gained more than 1% on Tuesday, and MRK and PFE were two big reasons why. It enabled the DJUSPR to climb back above key short-term price resistance and its 20 day EMA:
 We appear to be squeezing within a symmetrical triangle (lower highs, higher lows) so you might want to keep an eye on that to see which way we break. But in the very near-term, I like the increasing volume, close back above the 20 day EMA, and the PPO positive crossover vs. its trigger line (9 day moving average of PPO).
For the first time in awhile, defensive sectors had complete control of the action. Utilities (XLU, +1.64%), consumer staples (XLP, +1.16%) and real estate (XLRE, +1.15%) were the only sectors advancing more than 1% on the session. In fact, we didn't see an aggressive sector on the leaderboard until the 6th spot as industrials (XLI, +0.40%) led the uninspired aggressive sectors. Communication services (XLC, -2.25%) was the primary laggard, due in large part to GOOGL.
Pre-Market Action
The April ADP employment report was released this morning and it showed considerable job growth. In addition to crushing April expectations (275,000 vs. 180,000), the March number was revised upward from 129,000 to 151,000. That's a daily double from an economic perspective. We'll have to see on Friday if that translates into a better-than-expected nonfarm payrolls report. That report is much more closely watched by both market participants and the Federal Reserve. The bond market's response this morning is muted with the 10 year treasury yield ($TNX) flat.
I'll be watching the Fed announcement very closely. In March, the Fed indicated that they were downgrading their assessment of the economy and lowered their GDP forecast. Last week, however, the Q1 GDP jumped to 3.2% while the market was expecting 2.3%. Will this change the Fed's economic assessment and GDP forecast? Stay tuned.
Dow Jones futures are higher by 99 points, but action is even better on the NASDAQ after traders bid Apple's (AAPL) shares higher overnight after the tech giant beat estimates and provided a solid outlook.
Once again, we're seeing mixed action abroad as Asian markets saw China's Shanghai Composite ($SSEC) close higher, while both the Tokyo Nikkei ($NIKK) and Hong Kong's Hang Seng ($HSI) ended lower. It's much the same in Europe this morning.
Current Outlook
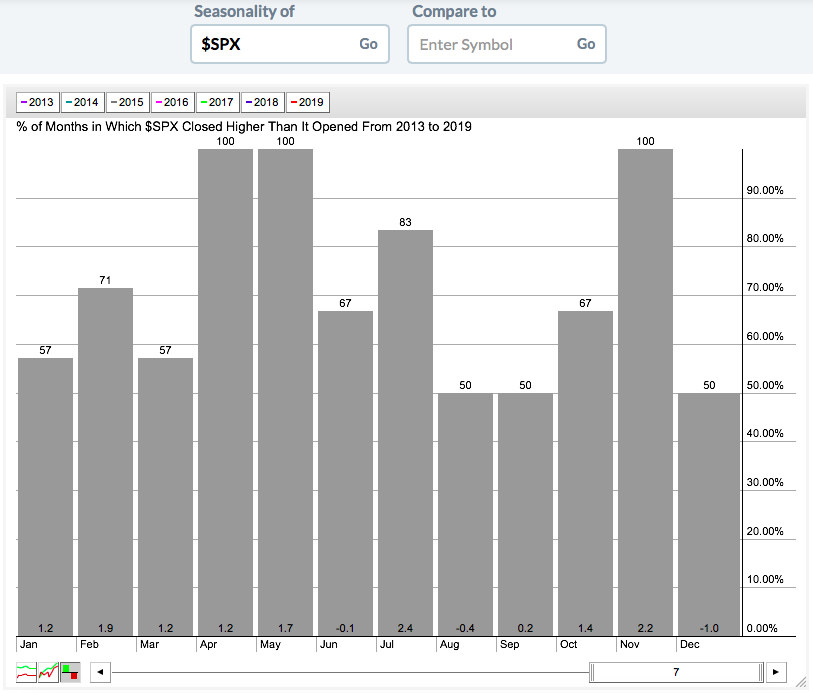
Being a historian, perhaps the most annoying Wall Street adage to me is "go away in May". It's simply false advertising, yet so many cling to it like doomsayers. Over the last 7 years, the S&P 500 has gone up every year in 3 different calendar months. Take a look:
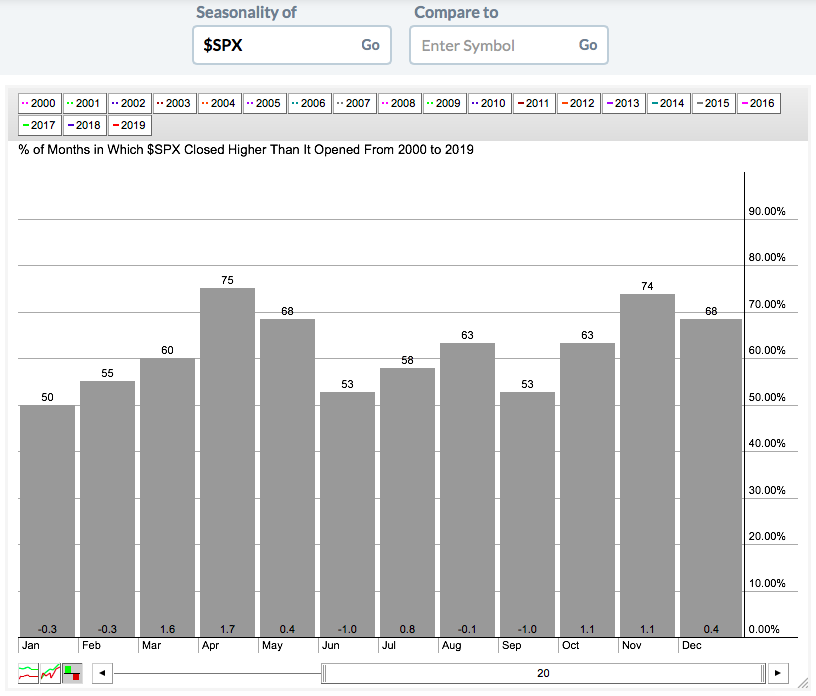
 April, May and November. There's a 7 year winning streak in May. I'd argue it's been the best calendar month of the year besides November. Ok I get it. I'm only talking 7 years here. In the Historical Tendencies section below, I extend the above chart to the last 20 years. April and November are the only two months that have moved higher with greater consistency than May.
I've tracked the S&P 500 since 1950. Perhaps the last 7 decades performance will convince you. The S&P 500 has risen 41 times during May since 1950 and fallen 28 times. The odds are greater of an increase. Furthermore, on the NASDAQ since 1971, May has produced annualized returns of +12.83%, trailing only four other calendar months - January, November, December, and April. Do you want to leave that type of potential return on the table?
I do agree with the "November through April" is better than "May through October" six month period. History definitely supports this argument. But that doesn't mean that May can't provide solid returns.
Here's one last piece of historic data. The NASDAQ's May performance can be broken down as follows:
May 1-5: +50.15%
May 6-25: -4.30%
May 26-31: +44.60%
There's clearly a lull mid-month but May typically gets off to a roaring start and the bull comes charging back late in the month as well.
If you're looking for a time to take a break from the U.S. stock market, it's from July 18th through September 27th. I'll share more details on that period as we move into summer, but annualized returns are decidedly lower throughout the summer.
Sector/Industry Watch
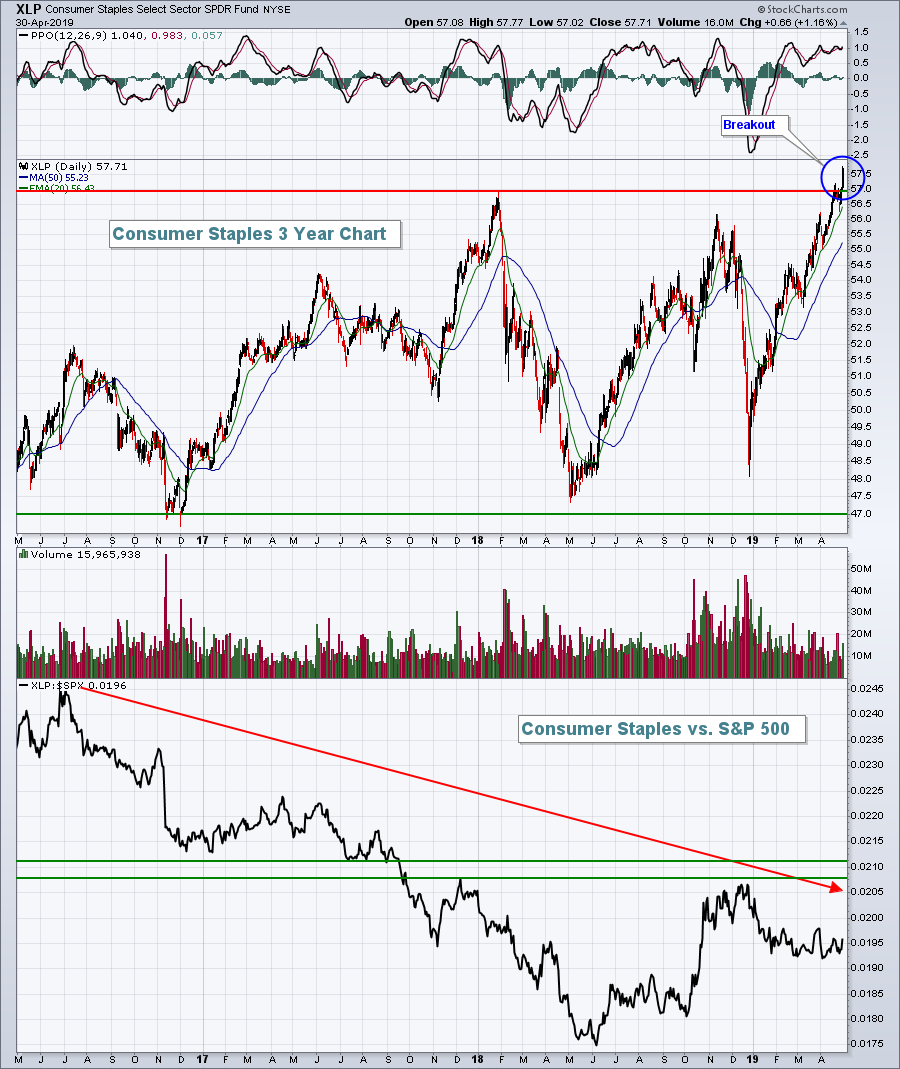
We saw outperformance on Tuesday in consumer staples (XLP) and their absolute chart is one of beauty:
 After consolidating in a 47.00-57.00 range for the past few years, the XLP finally made a decisive breakout. So we should jump right in, correct? Well, ummmm no. Look at the relative strength chart below. In a secular bull market, you want to overweight aggressive sectors as they outperform. If the XLP continues to outperform like it did yesterday, and clears the horizontal relative resistance lines above, that would be a bearish development for U.S. equities. We want to see the XLP, along with all defensive sectors, move higher, but we want them to underperform on a relative basis. That's what is currently in place. Beautiful.
Historical Tendencies
Here's a 20 year monthly performance chart on the S&P 500:
 May has advanced roughly two-thirds of calendar years over the past decade, trailing only April and November in that regard.
Key Earnings Reports
(actual vs. estimate):
ADP: 1.77 vs 1.69
ALNY: (1.42) vs (1.84)
AME: 1.00 vs .97
CDW: 1.24 vs 1.10
CLX: 1.44 vs 1.47
CME: 1.62 vs 1.60
CVS: 1.62 vs 1.50
EL: 1.55 vs 1.30
EPD: .57 vs .47
ETR: .82 vs .94
FTS: .56 - estimate, awaiting results
GIB: .88 vs .89
GRMN: .73 vs .71
GSK: .66 - estimate, awaiting results
HLT: .80 vs .76
HRS: 2.11 vs 2.04
HUM: 4.48 vs 4.30
IDXX: 1.17 vs 1.04
IQV: 1.53 vs 1.51
JCI: .32 vs .30
LLL: 2.89 vs 2.52
MMP: 1.06 vs 1.00
NI: .82 vs .77
PNW: .18 - estimate, awaiting results
RCL: 1.31 vs 1.11
SO: .70 vs .70
SPR: 1.68 vs 1.67
ST: .85 vs .85
TAP: .52 vs .57
WLTW: 2.98 vs 2.99
YUM: .82 vs .80
(reports after close, estimate provided):
ALL: 2.29
ANSS: 1.09
APA: .09
AWK: .63
CF: .28
CREE: .16
DXCM: (.17)
EQIX: 5.60
ES: .91
HCP: .43
HIG: 1.24
HOLX: .57
HST: .45
LNC: 2.08
MAA: 1.50
MET: 1.30
MFC: .52
MRO: .06
NLY: .29
O: .80
OTEX: .59
PRU: 3.14
PSA: 2.52
QCOM: .71
SQ: .08
SU: .39
TRMB: .46
WMB: .24
Key Economic Reports
April ADP employment report released at 8:15am EST: 275,000 (actual) vs. 180,000 (estimate)
April PMI manufacturing index to be released at 9:45am EST: 52.4 (estimate)
April ISM manufacturing index to be released at 10:00am EST: 55.0 (estimate)
March construction spending to be released at 10:00am EST: +0.2% (estimate)
FOMC policy statement to be released at 2:00pm EST: No rate change expected
Happy trading!
Tom


