Market Recap for Tuesday, June 25, 2019
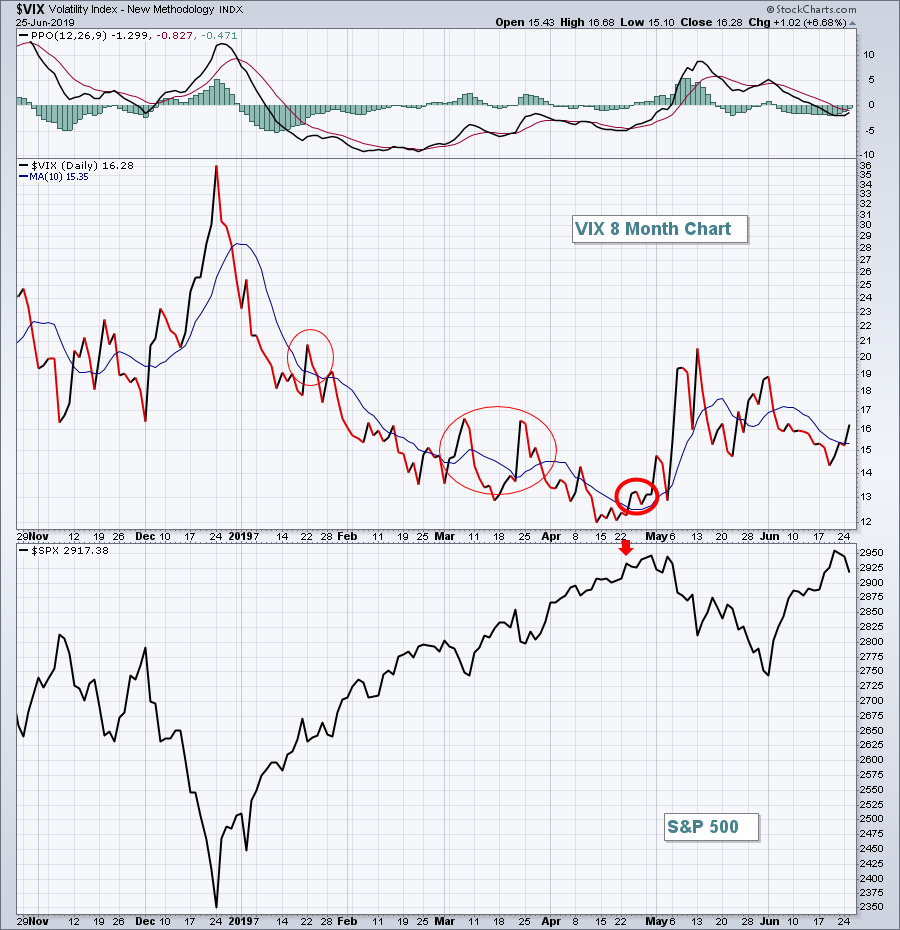
Sellers returned to the stock market yesterday as the NASDAQ posted a 1.51% drop, its largest decline since June 3rd. Volatility ($VIX, +6.68%) has been on the move higher as the market grows more nervous with the G-20 summit beginning later this week:
 The bold red circle shows the VIX breaking above its 10 day moving average from low levels (complacency). Other breaks above the 10 day moving average, including the latest, occurred with the VIX in an overall downtrend. I wouldn't pay as much attention to this sudden increase unless the downtrend created from the prior two tops was eclipsed. In other words, if the VIX remains below 17-18, I'd expect the downtrend to continue and equity prices to rise.
The other major indices also followed the NASDAQ lower, although the small cap Russell 2000 ($RUT, -0.59%) showed rare relative strength throughout much of the session.
Materials (XLB, +0.05%) was the only sector to finish in positive territory yesterday. Communication services (XLC, -1.86%) was the worst performing sector as internet stocks ($DJUSNS, -2.31%) stumbled. Technology (XLK, -1.84%) fared only slightly better as the high-flying software group ($DJUSSW, -2.71%) had another poor showing.
Pre-Market Action
The 10 year treasury yield's ($TNX) decline is at least pausing this morning, up 2 basis points to 2.01%. Gold ($GOLD), after a stellar advance, is off $4 to $1414 per ounce. Crude oil ($WTIC) is jumping, up more than 2% and nearing $59 per barrel.
Asia was flat overnight and Europe is following that same route this morning. Dow Jones futures are pointing to a decent open, up 60 points with 30 minutes left to the opening bell.
Current Outlook
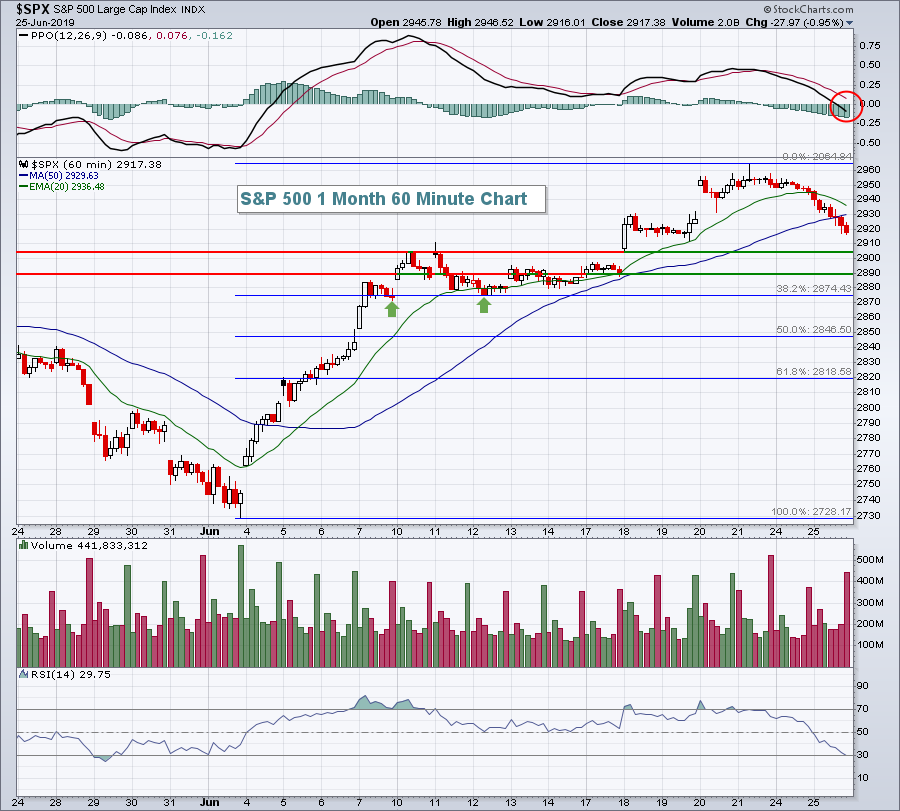
For the first time since early June, the S&P 500 has seen its price fall below both its 20 hour EMA and 50 hour SMA. In addition, it's also the first time this month we've seen the PPO move from positive territory to negative territory. The bears have reclaimed short-term control of market action. However, key short-term price and gap support, along with the initial key Fibonacci retracement level, should be monitored and respected:
 Note the 38.2% Fib retracement coincides perfectly with prior price support (green arrows). Therefore, I'd view the 2875-2905 support "zone" as critical in the near-term. Should selling escalate later this week or into next week, watch for a possible reversal in this zone.
Sector/Industry Watch
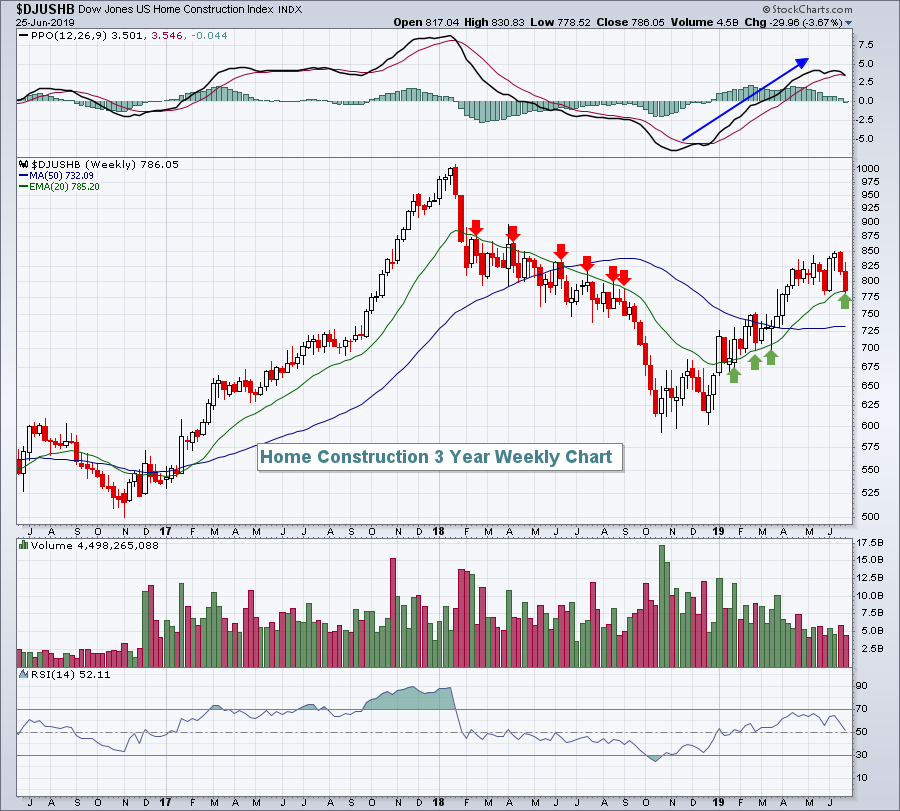
Home construction ($DJUSHB, -3.72%) stocks were extremely weak on Tuesday after the May new home sales report was released and missed by a wide margin to the downside. However, history tells us that rising 20 week EMA tests provide excellent reward to risk opportunities for entry into the group and we're at one now:
 Anything can happen, but the recent weakness appears to be presenting a solid short-term opportunity.
Historical Tendencies
July kicks off the most bearish period of the year, which begins at the close on July 17th. Here is a breakdown of how July has performed since 1950 on the S&P 500:
July 1-17: +24.70%
July 18-24: -18.72% (2nd worst calendar week of the year historically)
July 25-31: +19.12%
For more information on July seasonality, tune into MarketWatchers LIVE at noon today. I'll provide the best seasonal sectors, industry groups and stocks as we enter the slower summer season.
Key Earnings Reports
(actual vs. estimate):
BB: .01 vs .01
GIS: .83 vs .76
INFO: .71 vs .65
PAYX: .65 - estimate, awaiting results
(reports after close, estimate provided):
FUL: .89
KBH: .39
MLHR: .78
WOR: .77
Key Economic Reports
May durable goods released at 8:30am EST: -1.3% (actual) vs. -0.1% (estimate)
May durable goods ex-transports released at 8:30am EST: +0.3% (actual) vs. +0.1% (estimate)
May wholesale inventories to be released at 10:00am EST: +0.4% (estimate)
Happy trading!
Tom


